Hi everyone,
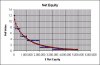
I'm bored! - so just for interest, I thought I would put up this poll to see how Somersoft is stacking up in this equity building game.
Equity = Net Assets = Total Assets - Total Liabilities (including PPOR and your partner's assets and liabilities)
Last time I did this, I called it the net worth figure and said you should not include your PPOR, which some of you disagreed with, so this time let's include the PPOR and call it equity or net assets...and see the results.
There's been a couple of these threads done in the past for comparison:
http://www.somersoft.com/forums/showthread.php?t=22808&highlight=worth
http://www.somersoft.com/forums/showthread.php?t=21142
GSJ
Last edited: