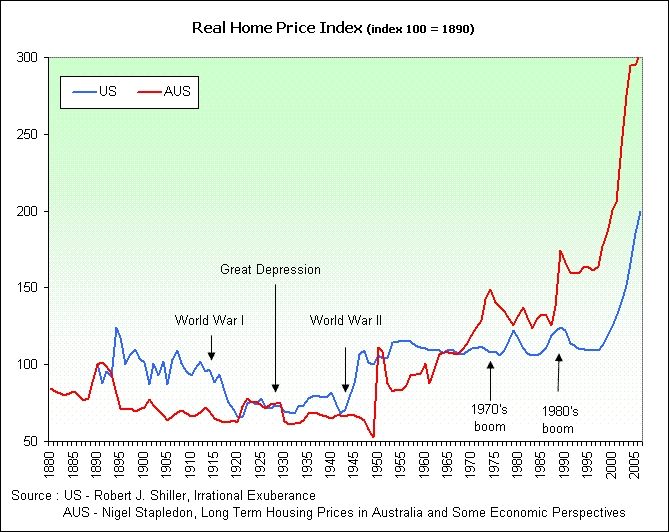
Thats a very interesting chart. Based on the last few peaks and following dips we should see (or have seen) about a 25% drop from the peak to the next low. Thats if the trend in increasing house values continues.
If we revert to an index of 100... thats about a 50% reduction...