101% performer: house prices double in a decade

I agree that the Netherlands is different from Australia. Australia's population growth is more rapid, the country is bigger, and less densely populated. And our transport network sucks. Though I thought we were talking about the 350 year trend of a SPECIFIC street in Amsterdam, not the Netherlands as a whole?
The main reason to ignore the 400 yr mean is that today jobs are concentrated in the CBD, people are prepared to pay to be near their job.

Until ~100 yrs ago most jobs were locally based - there was no need or desire for the majority to travel to the city daily.

And Australia is more different today than most other countries. Our 2 largest cities house 54% of the population. Other comparable countries have a more homogeneous distribution, with more major population centres and a smaller percentage of population each of in them. Netherlands has only 21% of it's population in it's 2 largest cities, US 17%, UK 18%.
 
Until ~100 yrs ago most jobs were locally based - there was no need or desire for the majority to travel to the city daily

Keith

With the use of technology this trend is returning so tomorrow we could doing the same job we are doing in the city from a cottage out in the bush
 
Keith
With the use of technology this trend is returning so tomorrow we could doing the same job we are doing in the city from a cottage out in the bush

It also means employees will be substituted with casual staff and subcontractors that will be very expendable have no job security, just as it was ~100 years ago.
I use many OS people to do work at a fraction of the cost for someone here to do it in the bush.
 
With the use of technology this trend is returning so tomorrow we could doing the same job we are doing in the city from a cottage out in the bush
Quite possibly. Video conferencing was supposed to be catalyst..... then high speed broadband. Neither have produced significant results AFAIK. I feel the problem is that managers feel the need to see bums on seats. Maybe permanent surveillance of the home office would satisfy them ? a permanently open Skype video link ?
 
even with the dismal performance of Amsetrdam property thru the ages, I still wish that I had a dutch grandparent that had a bought a resi IP in which the tenants covered outgoings and the debt was denominated as a loan from 400 years ago. could probably be discharged by scratching a bit of silver off of a captain cook 50c.
 
I think that people are missing the point.

Take a look at the graph linked to below, which correspond to Australian markets.
The graphs show salary multiples for the median house up the y-axis, and years (0 is 2000) on the x axis. Multiples for 2008 were pulled from the Demographia report, though it's ultimately an arbitrary choice. Salaries are assumed to rise at 4%, house prices by 7.2%.

The average house price in Japan hit ten times salary just before their property bubble burst. Given the sort of price movements that are being predicted in this thread, Sydney will hit that in five years, with Australia as a whole reaching it by 2025.

So my first point is that most people don't grasp exponential series.

My second point is that we've moved from being in a high to low rates of inflation.

100403_dg_graph1.gif


For most of the period from 1970 through to 1990, inflation was above 7%. In that case, house price rises of 7% (or more) would be supported by corresponding increases in wages.

With regards to a couple of points from above.
  • I don't disagree with KeithJ's point that different areas can rise at different rates, but I doubt that they can manage it consistently over the very long term. (Say 20 or 30 years.)
  • The fifty year period for population growth that Hooray queried was chosen because that's what Google spat out. That said, it's not a bad arbitrary choice. (Incidentally in 1650 the Netherlands had 1.9 million inhabitants, Australia had 315,000 to 750,000.)
  • The population density of the Netherlands (as a country) is broadly similar to that of the Sydney area. OK, it's a statistical quirk because Holland's so crowded...
  • Unfortunately I didn't have a Dutch ancestor to leave me an IP on the Herengracht either.
 
  • Like
Reactions: BV
I think that people are missing the point.

The average house price in Japan hit ten times salary just before their property bubble burst. Given the sort of price movements that are being predicted in this thread, Sydney will hit that in five years, with Australia as a whole reaching it by 2025.

So my first point is that most people don't grasp exponential series.

My second point is that we've moved from being in a high to low rates of inflation.

Good point, but if a person on an average wage buys an average property which has an average price, as long as the property is 5 times his salary it's affordable and if the same property during the next 10 years it gets a bit out of reach for the next average bloke and it's price becomes 7 times the average salary, it can still be affordable but it will depend on interest rates.

Ofcourse that same average bloke won't be able to buy something priced at x10 his salary but he can't do it today either and he wouldn't have been able to do it 10 or 20 years ago.

You've also mentioned that we've moved to a low inflation environment and this situation could now be permanent so our interest rates could be staying low for a long time so we'll be able to hold a higher than average loan.

something to think about...
 
I think that people are missing the point.
I agree.

Take a look at the graph linked to below, which correspond to Australian markets.
The graphs show salary multiples for the median house up the y-axis, and years (0 is 2000) on the x axis. Multiples for 2008 were pulled from the Demographia report, though it's ultimately an arbitrary choice. Salaries are assumed to rise at 4%, house prices by 7.2%.
Demographia has been rubbished here & elsewhere.
I'm not sure you have responded to my point above about affordability having nothing to do with house price levels, but debt levels. The Demographia study produces some crazy results for the same reason. It ignores the 50% deposits upgraders put down when the easily afford to service their new debt.

The average house price in Japan hit ten times salary just before their property bubble burst. Given the sort of price movements that are being predicted in this thread, Sydney will hit that in five years, with Australia as a whole reaching it by 2025.
Again irrelevant, it's debt levels that count.

So my first point is that most people don't grasp exponential series.
If inflation is 3% & wages grow at 4%, what does discretionary income rise at ? The answer is ~6-7% - an exponential series that corresponds with house prices rises.

With regards to a couple of points from above.
I don't disagree with KeithJ's point that different areas can rise at different rates, but I doubt that they can manage it consistently over the very long term. (Say 20 or 30 years.)
Remember my granny mentioned above..... she sold her place for $1.5M, she bought it 65 yrs ago for $2000 (pounds?). Compound that and you get 11%pa EVERY year. Her place isn't anything special, everything else in her suburb would have been bought & sold at similar prices.
The population density of the Netherlands (as a country) is broadly similar to that of the Sydney area. OK, it's a statistical quirk because Holland's so crowded...
Wiki disagrees with you by almost an order of magnitude :eek:...
Density of Netherlands is 396 people/km2
Density of Sydney is 2096 people/km2
 
Good point, but if a person on an average wage buys an average property which has an average price, as long as the property is 5 times his salary it's affordable and if the same property during the next 10 years it gets a bit out of reach for the next average bloke and it's price becomes 7 times the average salary, it can still be affordable but it will depend on interest rates.
Average people on average wages buying an average property also have an average deposit. The average FHB has only a 10-20% deposit. Upgraders who have been paying down principle for 10 yrs while their house value has doubled have a 50%+ deposit.

The average new loan taken out is $270K. The rest of the $$$ to purchase an average house comes from the sale of the previous one.

Of course that same average bloke won't be able to buy something priced at x10 his salary but he can't do it today either and he wouldn't have been able to do it 10 or 20 years ago.
He can if he has an average deposit... like 50% from the sale of his old house.

As an extreme example, my granny on a pension can afford to buy a $1.5M house, because she has a $1.5M deposit & needs to borrow nothing.

House prices have historically averaged around 3.5x average salary. There are lots of good reasons why this mean has changed. A large deposit in one of them.
 
For ease of the maths, let's say that FHBs have 1.5 times their salary as a deposit, plus 3.5 times as a mortgage. They can then afford a house worth five times salary. Salaries rise by 4% per annum and house prices by 7%.

Then:
  • Year 0 - 5 times salary for property, 1.5 times for deposit.
  • Year 10 - 6.7 times salary for property, 3.2 times for deposit.
  • Year 20 - 9 times salary for property, 5.5 times for deposit.
If KeithJ's right, then by 2020 FHBs will need to save a deposit equal to what their parents borrowed to buy their home. I can't see that working out.

Graemsay - your maths is fine, however your statistical sampling is incorrect. You are using incorrect input data to create your assumptions.

You forgot the most FUNDAMENTAL POINT of this whole argument - you cannot look at the same house, whilst using NEW input variables.

IE: the "average" first home buyer in year 0 is NOT THE SAME as the "average" first home buyer in year 10 - because the guys from year 0 has had capital appreciate and mortgage reduction help him build up equity... unlike the FHBer from year 10, who only has a deposit.

I'll try and simplify for you, using YOUR input data.


  • Lets say that your FHB (lets call him Joe) in year 0 buys a $100k house, 20km from the CBD. His salary is $20,000. His deposit is $35K, and his mortgage is $65k (3.25 times salary)
  • In year 10.... Joe, that bought his $100k house in year ZERO has now paid down his mortgage by say $20k (1/3rd), and his house has INCREASED in value by $96k up to $196,000.
  • He now has a sizeable chunk of equity ($141K). His salary is now almost $30k, in line with 4% increase of the average wage.
  • Based on your metric of 3.25 times salary is what mortgage he can afford, he can now afford a $97,000 mortgage... plus his $141,000 equity as deposit... so he sells his old house, and moves into a swanky house closer to the CBD at just 15km from the CBD worth $238,000.
  • At the same time, in year 10, Tom is a FHB and is looking for a house to buy. His salary is also the "average" of the day, being $30,000. He has a $45,000 deposit (1.5 times wage), and can afford a mortgage 3.25 times his wage... $97,000. This equates to buying a $142,000 house.
  • Of course Tom cannot afford to buy Joe's house....... well derrrr!!.
  • The city has naturally grown in size in 10 years, so Tom has to look further out for WHAT HE CAN AFFORD TO BUY, at around 30km from the CBD.
  • ..... lets fast forward to year 20.
  • Joe's new house, 15km from the CBD, has increased in value from $238K to $468K. He paid down hir mortgage by 1/3rd (mortage now only $65K), so he now has $403,000 in equity. (niiiiice!)
  • Tom's house has also increased from $142K up to $279K. He also paid down 1/3rd of his mortgage (like Joe, only $65K remaining)... so he now has $214,000 in equity.
  • Both Tom and Joe, being the SAME average wage earners of the day, now both earn $44,400pa. Therefore they can both now afford a $144,000 mortgage (using the 3.25 times wages "metric").
  • Joe can therefore now upgrade to a $547,000 home.
  • Tom can now upgrade to a $358,000 home.
  • ... and Joes first home, bought for $100,000 in year 0, is now worth $387,000 in year 20.... so Tom can now *almost* afford it.


Have a good think about it Graemsay. Seriously.
 
BV, I agree that lower interest rates improve affordability. The question is by how much. The economists' argument is that it's proportional to the interest costs, as any repayment is enforced savings. I'd argue that it should be the repayment costs.

I suspect that a high inflation / high interest rates environment actually makes it easier to buy property. Interest rates will cap prices through affordability, whereas inflation will reduce the debt in real terms.

KeithJ, I'm not convinced that the build-up in equity is going to help a second time buyer. Sure, they get a nice deposit, but there's a correspondingly larger jump to their next house.

For example:
  • Year 0: Bought house for $200K, next house is worth $300K.
  • Year 10 @ ~4%: Owned house is worth $300K (with $100K equity), next house is now $450K.
  • Year 10 @ ~7%: Owned house is worth $400K (with $200K equity), next house is now $600K.
  • Year 10 @ ~-4%: Owned house is worth $130K (with $70K negative equity), next house is now $200K.
In terms of a house as being a place to live, and not an investment (and, yes, I might be missing the point of this board), the negative equity scenario is the best outcome if the owner is looking to upgrade. The big if would be whether he or she could get a mortgage in those circumstances.

From a wealth point I suspect that the 7% growth gives the best returns, but it would depend on the balance of rent versus mortgage costs.

Whether or not Demographia's figures isn't really an issue. It just means that the sorts of price levels will be reached later, rather than sooner.

Absolute prices are important. I estimate if they get to the 10 - 12x income to price mark, then the repayment on the average house would cost the entire of an average salary. Which begs the question, who's going to buy all these really expensive properties in 20 or 30 years time?

Incidentally, my population density figures were based on the area and population of the Sydney region (12K km2 / 4.4 million) and the Netherlands (41K km2 / 16.5 million). They're not that far apart, and parts of Holland are rural.

And your grandmother made a very astute purchase. :)

Witzi, I'm still not convinced. It'll take Tom nearly twenty years of mortgage repayments to be able to afford Joe's first house. I haven't run the calculation for a FHB who enters the market in year 20, but I suspect that it might take him until after retirement!
 
KeithJ, I'm not convinced that the build-up in equity is going to help a second time buyer. Sure, they get a nice deposit, but there's a correspondingly larger jump to their next house.

For example:
  • Year 0: Bought house for $200K, next house is worth $300K.
  • Year 10 @ ~4%: Owned house is worth $300K (with $100K equity), next house is now $450K.
  • Year 10 @ ~7%: Owned house is worth $400K (with $200K equity), next house is now $600K.
  • Year 10 @ ~-4%: Owned house is worth $130K (with $70K negative equity), next house is now $200K.
Remember to add in the principle they are paying down... the average Australian home loan is paid off in 7 yrs. And remember that their wages have increased @ 4.5%pa, and their discretionary income has approx doubled.

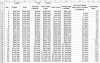
Here's a picture of a spreadsheet (using your assumptions), showing what happens in reality. Assume wages grow at 4%, houses increase at 7.2%, and they pay down principle over 25 yrs at 7.5% average IR. Also assume they put down 20% deposit on a house worth 5x their salary, ie borrow 4x their $50K salary.

attachment.php


Column G shows the most expensive house they could afford to buy, based on the same constant borrowing 4x salary and putting down a deposit of their existing equity. In Yr 1 it's still 4x salary, plus $50K deposit, after a year of paying principle & price appreciation, their house is worth $268K, their wages are up $2K, so they could afford a slightly more expensive house at $278K, only $10K in real terms better than their current house.

Fast forward 10 yrs..... and after house price appreciation, & paying down principle their house is worth $500K, they have a equity of $342K, and their wages have increased to $74K... so using the same borrow 4x salary, and put down equity as a deposit as a deposit formula, they can afford to buy a $638K house. Their existing house is worth $500K, they can afford to buy a house 27% 'better' at $638K. This 'better' house would have cost them $317K ($250K x 127%) back when they started, so was well out of their price range.

But the most interesting column is Column I. This $638K house costs a whopping 8.6x their salary. They can easily afford to buy because we're still using the borrow 4x salary formula.

All these assumptions are the most conservative... 4% wage increase, paying off mortgage over 25 yrs (& not 7), only borrowing 4x salary (not 5 or more)., never promoted, so no wage increase above inflation.

In terms of a house as being a place to live, and not an investment (and, yes, I might be missing the point of this board), the negative equity scenario is the best outcome if the owner is looking to upgrade.
Sure it's a great theory.... however.... it would need some exceptional circumstances for that scenario to happen. I can think of lots of great theories that would be personally advantageous, unfortunately they bear no resemblance to reality.

Absolute prices are important. I estimate if they get to the 10 - 12x income to price mark, then the repayment on the average house would cost the entire of an average salary.
Absolute wages are important too, as are absolute deposits/equity. Try using average debt instead of using average price.

My grannys pension is $15K(?), her house price/income ratio is 100x..... Demographia would have a field day :).
Which begs the question, who's going to buy all these really expensive properties in 20 or 30 years time?
As the spreadsheet above shows, it'll be really average people on really average incomes, who have invested (by default) in property and saved sensibly by paid down principle.

And your grandmother made a very astute purchase. :)
There was nothing astute about it. It was the cheapest crappiest house in Sydney at the time - it was all they could afford. I guess back then all the 'nice' houses closer in cost 10x their salary :rolleyes:.
 

Attachments

  • PriceSalary.jpg
    PriceSalary.jpg
    105.2 KB · Views: 543
Last edited:
Witzi, I'm still not convinced. It'll take Tom nearly twenty years of mortgage repayments to be able to afford Joe's first house. I haven't run the calculation for a FHB who enters the market in year 20, but I suspect that it might take him until after retirement!

But you are still missing the point.
In the space of 10 years, the location of the "average first home buyers home" has MOVED further away from the CBD... and it will continue to do so over time, as the city naturally grows and centrally located property becomes more valuable.

So what is the relevance of Tom "NEEDING" to buy Joe's 1st house?

I think you missed the point somewhat.

For example. My parents first house was a unit in Ryde (sydney). This was all they could afford. Over time they have built up equity and upgraded accordingly, moving into more desirable suburbs/locations.
My dad now lives in a >$1,000,000 home in Bilgola (northern beaches), overlooking the water.

20 years later, as my first home, i could not afford a unit in Ryde similar to what my parent's purchased.
All i could afford for my first home was a weeny little 3bed fibro house out in Colyton - which i bought as an IP 12 months ago.


Why should the metric of the average home be applied to first home buyers over a period of time, when the "average home" in a city is NEVER the same as what the average first home buyer is buying???
 
A bit off topic. but in the DVD shops see if you can pick up 'They're A Weird Mob'.

An Italian migrant in the sixties becomes a builders labourer and it shows putting in the foundations on his first day on the job and some related building activity. Quite took me back. Apparently they actually built the house as part of the filming and then sold it to help cover film costs.

Perhaps a Sydneysider could quote prices now, but it was on a bluff overlooking the water. The 'cheap block' for the newlyweds to build on. No doubt now the value would fund a blockbuster!

Quite a reminder of where housing came from.

It was the cheapest crappiest house in Sydney at the time - it was all they could afford.​
 
keithj - kudos to you buddy.

You just explained what i was trying to explain, but much betterer :p

It's funny how much the D&G crowd spouting the "house price vs income ratio" being out of control totally forget this point we are making..... its a FUNDAMENTAL point!!
 
keithj - kudos to you buddy.
Yes, x 2 for me as well :)

It's funny how much the D&G crowd spouting the "house price vs income ratio" being out of control totally forget this point we are making.....
At the end of the day a man with an experience will beat a man with an argument everytime. :cool:

We'll go out and continue to buy houses that double every 10 years or so (just like we've done in the past) and Graemsay can keep posting his graphs and his arguments on why it should not be happening and why it cannot continue to happen into the future :rolleyes:

You forgot how much he will whinge about housing being unaffordable, because what he COULD have afforded 10 years ago will now be totally unaffordable for him, and he has to move to a less desirable area to be able to buy what he can afford.

In the meantime, I will now be living on the northern beaches, and loving life.
 
I'm still not convinced. :)

I can see how things work from KeithJ's spreadsheet, though the the amount of money required to buy a 37% "better" house spirals upwards from around $90K in year 1 to almost $700K (including repayments to the mortgage) in year 25.

The real term problem that I see is long term affordability: If prices do increase ahead of wages by the sort of rates that are being discussed then, very roughly, your grandparents could (for the same, equivalent wage) afford four times as much house as you; your parents could afford twice as much; and your children (if you have any) will be able to afford half as much.

Yes, I'm aware that moving further out from the CBD will offset some of this, but the question remains: Who is going to be able to afford to pay for the substantial amount of expensive housing stock?

The reason that I'm making this point is that if there are few buyers who can afford high prices then they cannot be supported at this point.

KeithJ, your point about the average mortgage being paid off in seven years is interesting. I'm wondering how that'll change, given there was a big jump in prices in the late nineties / early noughties.
 
I'm still not convinced. :)

Well, that's why you're just thinking and talking about it instead of profiting from it. How long have you been unconvinced, by the way? 5 years? 10?

If prices do increase ahead of wages by the sort of rates that are being discussed then, very roughly, your grandparents could (for the same, equivalent wage) afford four times as much house as you; your parents could afford twice as much; and your children (if you have any) will be able to afford half as much.

That's pretty much it. Look at all the older people with million dollar houses close to the city. How did they do it? Simple: it wasn't that close to the city when they bought! After 50 years of appreciation, your grandparents owns (they can't afford to buy it now, of course) a 1m place, your parents, by selling their old home, using that as a big deposit and with a higher salary than you, might afford a $500k place, and you as a first home buyer with a minimal deposit and lower salary than your parents might only be able to afford $250k.

Yes, I'm aware that moving further out from the CBD will offset some of this, but the question remains: Who is going to be able to afford to pay for the substantial amount of expensive housing stock?

From:
1) savings via paying down their mortgages,
2) increase in value of their existing property
3) increase in nominal salaries with experience, promotions, etc.

The reason that I'm making this point is that if there are few buyers who can afford high prices then they cannot be supported at this point.

You keep talking and trying to make sense of it while the rest of us are getting rich. The sun might burn out soon too.
 
Back
Top