
Install the app
How to install the app on iOS
Follow along with the video below to see how to install our site as a web app on your home screen.
Note: This feature may not be available in some browsers.
You are using an out of date browser. It may not display this or other websites correctly.
You should upgrade or use an alternative browser.
You should upgrade or use an alternative browser.
Aussie Housing Market Snapshot
- Thread starter Shadow
- Start date
More options
Who Replied?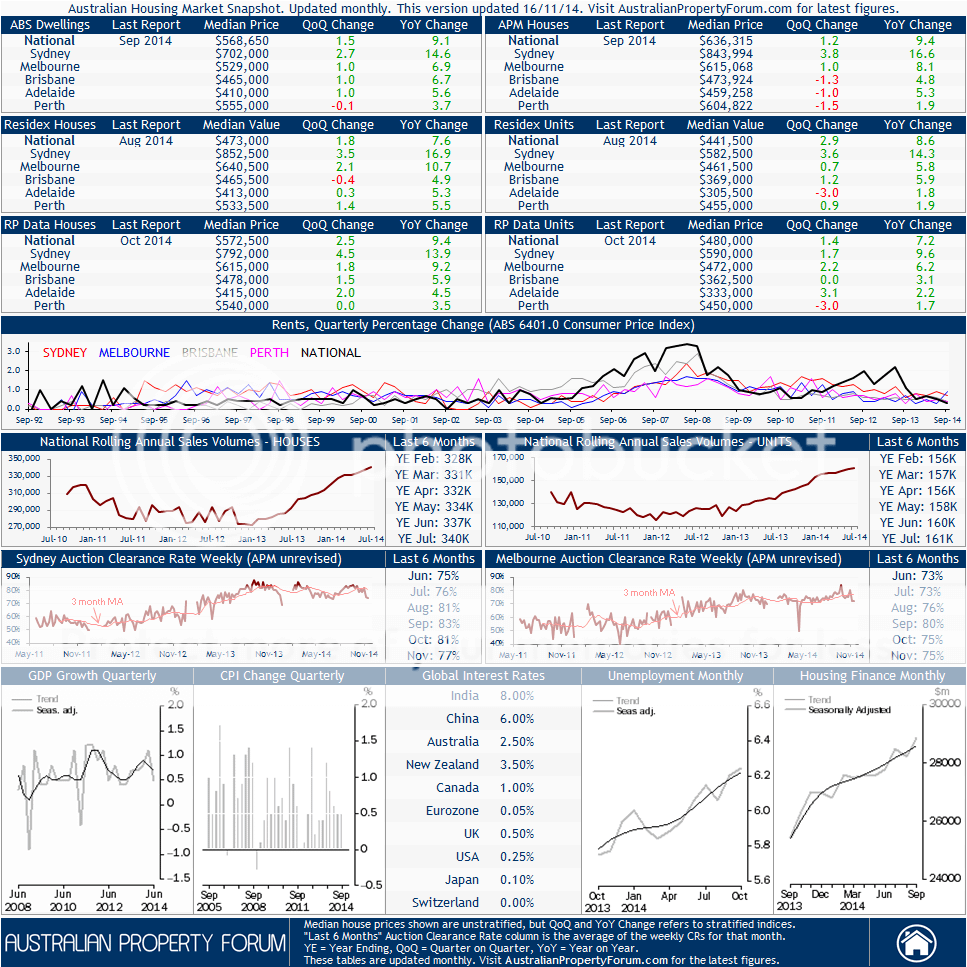
I've had a couple of glasses tonight, so I may be missing something, but there seems to be quite a disparity between the various sources.
Residex has Perth unit prices up over 11% year on year, and R P data has them slightly down?
I was wondering whether aggregating them might make more sense.
As a lot of the figures are fairly low, in percentage terms the variation is quite large.
Residex has Perth unit prices up over 11% year on year, and R P data has them slightly down?
I was wondering whether aggregating them might make more sense.
As a lot of the figures are fairly low, in percentage terms the variation is quite large.
A more complete list here:the list of global interest rates is interesting
http://www.tradingeconomics.com/country-list/interest-rate
Shadow, thanks for posting.
It would be great if you could update regularly.
Cheers, the charts are displayed below the APF site and the admin there said he's planning to update it every few weeks or so... I'll repost a copy here if I notice any changes to it.
If you could post historical graphs of "number of houses on the market" for all major cities, it would be very useful to all of us.
SQM Research has this info... http://www.sqmresearch.com.au/free-statistics.php
(the above charts aren't mine - I just linked to the image from another site)
I've had a couple of glasses tonight, so I may be missing something, but there seems to be quite a disparity between the various sources.
Residex has Perth unit prices up over 11% year on year, and R P data has them slightly down?
I was wondering whether aggregating them might make more sense.
As a lot of the figures are fairly low, in percentage terms the variation is quite large.
It's true there is some disparity over the figures at the moment. This often happens during 'turning points' in the market - i.e. when the market moves from general decline to general growth (and vice versa).
Perth is also one of the more volatile markets due to the lower stock (compared to the bigger cities).
Also, the RPData daily index lags reality by several months, as pointed out by SQM Research and others - see below...
RP Data daily index lags by several months. Louis Christopher of SQM Research agrees.
The daily RP Data index is primarily built using sales information from Land Titles Offices as the data comes in, so the index movement each day is really telling us what happened several months ago, because there is a delay of several months before RP Data receive the sales information. We should really think of today's RP Data 'daily' index figures as a cumulative result for the past six months or so.
I agree that aggregating the figures would probably give the best indication of what is happening... I might suggest this to the person who puts together the chart.
Sydney house prices still have to rise by nearly another 80% to reach your predicted $1.25m in the next 1-2 years, big call! Still think they can do it?
http://somersoft.com/forums/showpost.php?p=362901&postcount=8
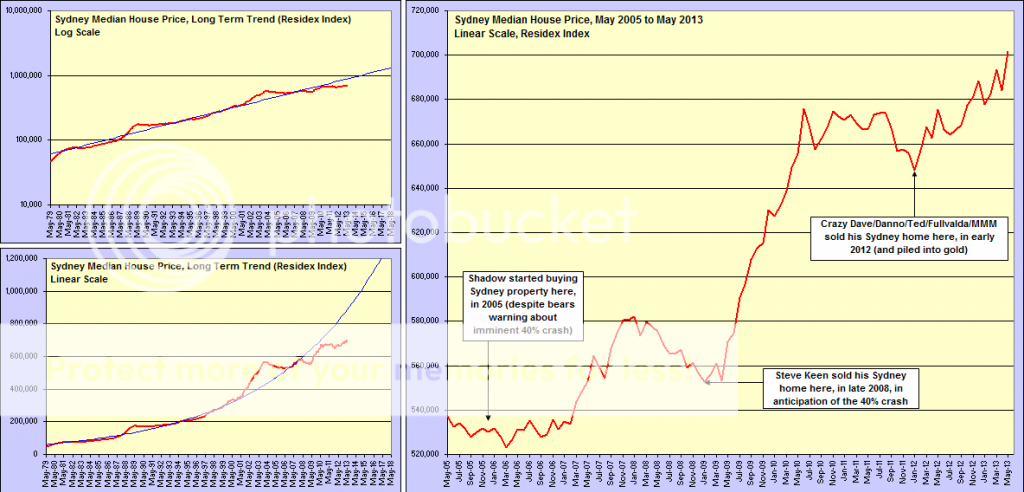
I think this boom has already begun in several cities. My prediction, simply based on extrapolating the median price lines against the trendlines, following similar peaks and dips to previous booms...
Peak of boom: 2014-2015. Sydney Median Price: $1,250,000
Bottom of bust: 2017-2018. Sydney Median Price: $1,100,000
http://somersoft.com/forums/showpost.php?p=362901&postcount=8
I think they'll approach $1M by the end of 2015.Sydney house prices still have to rise by nearly another 80% to reach your predicted $1.25m in the next 1-2 years, big call! Still think they can do it?
http://somersoft.com/forums/showpost.php?p=362901&postcount=8
But it doesn't really matter, aside from internet bragging rights... they are obviously rising and I made the right call to stay in the market for the past several years while bears all around me were selling and panicking about 40% crashes. Ironic how the 40% crash ended up happening to gold rather than property.
Ohhh. So you changed your prediction? Aren't you always giving Steve Keen grief about doing the same?I think they'll approach $1M by the end of 2015.
But it doesn't really matter, aside from internet bragging rights... they are obviously rising and I made the right call to stay in the market for the past several years while bears all around me were selling and panicking about 40% crashes. Ironic how the 40% crash ended up happening to gold rather than property.
Anyway, interesting that you started buying almost right at Sydney's peak when priced in Gold:

The Gold crash is not reflected on this chart as I need to update the data, but up to date data would put the ratio at around 500 ounces (700k / $1380). Sydney prices have crashed when priced in Gold!
I give Steve grief because all his predictions have been wrong.Ohhh. So you changed your prediction? Aren't you always giving Steve Keen grief about doing the same?
My prediction is not wrong - it has another two and a half years to run.
And no, unlike Steve Keen I won't change my prediction if it does prove to be wrong.
Unlike Steve I won't, after the fact, pretend I meant some other date or some other timeframe or some other figure.
If I'm wrong by the end of 2015 I'll be the first to admit it.
You can't buy a house with gold. I used dollars, most of which I borrowed from somebody else. Nobody would lend me enough gold to buy a house.The Gold crash is not reflected on this chart as I need to update the data, but up to date data would put the ratio at around 500 ounces (700k / $1380). Sydney prices have crashed when priced in Gold!
Do you know many people with enough gold to buy a house?
If I'm wrong by the end of 2015 I'll be the first to admit
I wonder if Tom Waterhouse has a book running on this
I think they'll approach $1M by the end of 2015.
The average punter would need to be earning around 200k to have half a chance I don't like those odds
You've already changed it. From $1.25m initially, now you are saying "approaching" $1m. Just like you try and play with the wording and timing of your predicted construction boom which never eventuated in 2010/2011.My prediction is not wrong - it has another two and a half years to run.
And no, unlike Steve Keen I won't change my prediction if it does prove to be wrong.
Depends on how low the ratio getsDo you know many people with enough gold to buy a house?
")
Ohhh. So you changed your prediction? Aren't you always giving Steve Keen grief about doing the same?
Anyway, interesting that you started buying almost right at Sydney's peak when priced in Gold:
The Gold crash is not reflected on this chart as I need to update the data, but up to date data would put the ratio at around 500 ounces (700k / $1380). Sydney prices have crashed when priced in Gold!
Don't understand how you've done your pricing of Sydney house prices vs gold.
The proper way to do it would be to rebase the median Sydney house price in 2005 to the gold price at the time. Then take the current Sydney house price today, divide it by the previous median house price, and multiple it by the gold price at the time. Using excel you can lock in the denominator and multiplier and graph it.
Your graph implies Sydney house prices have crashed 50% from 2005 to now. I presume this is a relative overperformance/underperformance graph?
You've already changed it
Yes, when the facts change, I change my mind. What do you do?
I lowered my prediction over four years ago, in 2009, long before its 2015 deadline (the prediction had another six years left to run) and I haven't changed it again since then.
I don't see a problem with changing a forecast well ahead of the due date. Anybody who sticks doggedly to a single prediction over a seven year period without considering new data is just being silly and stubborn.
As it stands, either my original prediction or the revised prediction may be proved right - we'll know by the end of 2015. So far, neither is wrong.
The difference is that Steve Keen waited until after his prediction had failed, then changed it and tried to pretend he never made the original prediction.
His original prediction was a 40% crash from 2008 levels within 'a few years'.
But by 2010 house prices had risen another 20%, so his prediction had clearly failed.
So he changed his prediction to a 40% crash from the new higher 2010 peak and pretended the original prediction never existed.
Now his latest prediction, made just last week, is a 70% crash between now and 2033.
No, I've already conceded that my construction boom prediction was a few months out and didn't actually begin until early 2012.you try and play with the wording and timing of your predicted construction boom which never eventuated in 2010/2011
But given that I predicted it five years in advance, I'm not too concerned about being a month or two out.
Last edited:
I predict World War Z between now and 2250.