
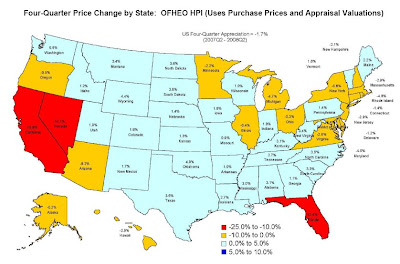
The map above (click to enlarge) is from the latest housing report from the Office of Federal Housing Enterprise Oversight [OFHEO], showing the "Four-Quarter Price Change by State" from 2007:Q2 to 2008:Q2 in the OFEHO House Price Index, which averaged -1.7% for the country.
However, notice that the biggest price decreases over the last year in the OFHEO House Price Index [HPI] have taken place in 4 states: CA (-15.8%), NV (-14.1%), FL (-12.4%) and AZ (-9.2%), see previous CD post (data through 2008:Q1 for that post). After those four states, the next closest price decline was the -4.85% decline in Rhode Island, after AZ (-9.2%). If you take out those four states (CA, NV, FL, AZ) the overall price decline over the last year was only -.75%. That is, the huge price decreases in the four states contributed about -1% to the overall national decline of -1.7% (without weighting for the size of each state).
Further, house prices have increased over the last year in 30 states, ranging from +0.56% for WA to +4.93% in OK, including increases of more than 4% for two states (OK and WY), and increases at or above 3% for 12 states (OK, WY, TX, OK, SD, ND, MS, AL, NC, SC, KY, WV). Finally, more than half of the states (27) have experienced home price increases of 1% or greater.
Comment: The way it gets reported in the media, you would think the entire national real estate is crashing, with home prices everywhere in "free fall," when the reality is slightly different: Over the last year, there have been significant home price corrections in only 4 states of between -9 and -16%, moderate price declines of between -2 to -5% in 9 states, and price increases in 30 states of between +0.56% and +4.93%.