Is Australia facing the first recession in 20 years?

What economic outlook does Australia face over the next 12 months?

  • TEOTWAWKI (google it)

    Votes: 4 2.1%
  • Depression

    Votes: 7 3.7%
  • Recession

    Votes: 42 22.5%
  • Slight Downturn

    Votes: 64 34.2%
  • Steady As She Goes

    Votes: 54 28.9%
  • Continue To Boom

    Votes: 16 8.6%

  • Total voters
    187
Being gay, I have a lot of gay friends. From my observation I don't think home ownership rates are any different for gays, so I disagree.

Out of my circle of friends:
  • One thinks you're mad to buy, renting is cheaper and he lives week to week on a median wage. I'm sure we all know someone like this.
  • One never has any money because he is a PI negative geared to the max. I'm sure we all know someone like this.
  • A couple who bought ~ 5 years ago and paying the mortgage down quickly so they can comfortably afford to have kids. I'm sure we all know someone like this.
  • Around 3/4's own, and the rest rent.

I see a masters research topic in it!

I stand corrected. 75% owned is actually above the average of 70% owned but may I ask, of those who own, do they own as individuals or couples, % wise.

Is is for the thesis.;)

Peter
 
Why don't we go to zero percent? Because inflation will go nuts. Countries like the US are in way more trouble than we are. Imagine if their rates weren't at zero...

Makes you wonder if the rates did go that way,and anyone living off cash -generating products will be in real problems,when i started the rates were 19% but unemployment was very low,unlike today,even today when having a quick look at the Government Auctions on site i was told on the quite that the Qld Government Car Fleet Auctions will finish in 2 months,all the work force will be layed off,and all the Qld Gov Cars will be kept for 2 years not one as they now do,everywhere i go people are people are been given the "DCM",because of the shocking mess Labor left Qld in,God only help us if flash in the pan stardom of Gillard if they get another term..
 
I stand corrected. 75% owned is actually above the average of 70% owned but may I ask, of those who own, do they own as individuals or couples, % wise.

Is is for the thesis.;)

Peter

Well either of us could be right, it's not like I have a sample of thousands.

Out of the ten households I know that own, only two couples got together before buying. One couple own jointly and one as an individual. Five house owners are single. Of the couples that formed after one (or both) owned individually I imagine they are still all owned by individuals - I imagine just like straight couples.

From my experience gay couples do tend to keep more separate finances.
 
Well either of us could be right, it's not like I have a sample of thousands.

I can double your sample, living in what is becoming known as a gay suburb.

Most of the gay households (MM and FF) I know are not any different from the straight ones. Most have mortgages, half have little kids. And associated with these are the usual dramas that beset most of us.

The only difference I can discern is that the blokes tend to have neat houses.
 
Well,

As per this statistics data:

121107%20Christopher%201.png


it seems that the national housing price rebound is still slowly developing not crashing. But when you read through this article from http://www.moneymorning.com.au/20121115/attention-investors-this-market-is-worse-than-it-looks.html

The situation is getting worse :-(
 
The bulls like myself believe that history will repeat itself and lower interest rates will eventually trigger a building cycle that in turn will drive domestic economic growth. The bears counter this by saying it is different this time because household debt still sits at a lofty 172 per cent of gross income. They believe any spare income from lower interest rates will be used to pay down debts and not ploughed into the property market.

In the early 1990s, household debt was only about 50 per cent of gross income, providing a sturdier platform for a housing boom.

If the bears are right, the Australian economy has a real chance of falling into recession as the peak of the mining and energy boom passes. We may talk about developing new areas of growth such as education, technology, tourism and high-level manufacturing, but the reality is these are niche industries that will take many years to develop into major engines of growth.
Housing is our only realistic hope of avoiding a protracted period of substandard economic growth.

Read more: http://www.theage.com.au/business/i...-pipe-dream-20121118-29k61.html#ixzz2CcsQnjzX

Further analysis from Leith at Macro Business: http://www.macrobusiness.com.au/2012/11/can-housing-construction-fill-the-void/
 
Ok. so my comment is JOBS.

If people have a job, feel secure in their job, then we may well see a Housing Boomish but I still fear the Rudd 2008 FHO Push brought a heap load stock on the market that exhausted demand, especially in Melbourne.

VIC is stagnant re economic activity as whole. We don't have mining and agriculture is in recovery after years of drought.

Housing wise this translates Traditional Builders I know looking for jobs. Developers offering "deals"on land sales like pay your stamp duty, new car, pay your 10% builders deposit.

But who knows, in the end, keep your own job and you will have opportunities.

Peter
 
Just came back from a property conference on Friday last week where one of the key speakers was a senior economist from the CBA.

Recession? Australia? You have to be joking. Obviously this is the spin of the X & Y generations are putting on it, our current economic conditions don't even rate on the world scale of up sheep creek or drowning in debt.
Given CBA's massive exposure to residential property loans and the likelihood that a recession could put them under severe pressure, you don't think they'd have any reason to present a particular bias in order to maintain confidence (if only as a facade to keep people buying their shares)?

re debt:

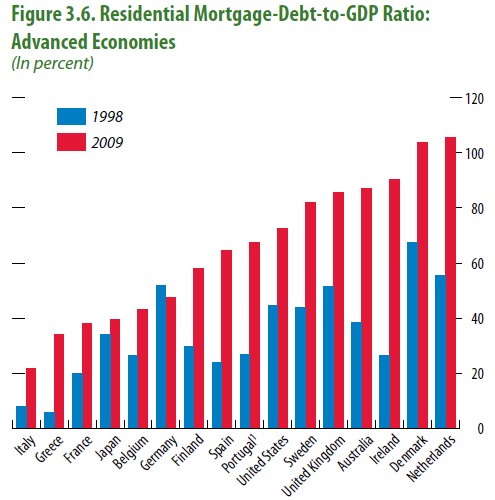
This rise in private credit, which is largely attributable to housing debt, has seen Australia become one of the most heavily mortgaged nations in the developed world (chart from the IMF):
IMF-Mortgage-Debt-to-GDP.jpg

http://www.macrobusiness.com.au/2011/12/we-are-all-keensians-now/
 
The IMF has been singing the praises of our banking system for some time, most recently this...
"Dr Cheng said the stress tests conducted by the IMF showed Australia’s banks would hold up even in the event of a 5 per cent drop in GDP and 35 per cent fall in house prices."
which by even most chicken little's, is a massive decline in house prices.

Purely anecdotal, but I sold a flat on the weekend that I've owned for a while and there were 4 bidders. The Melbourne market isn't so bad at the moment and another rate drop will see further enthusiasm.
You need to pay less attention to the macro level economics and put all that energy you use in studying that into how you can make money out of realestate. For example, buying a small house on a block (a land value house) where you can build something in the backyard and then perhaps onsell with plans or perhaps buying an older style flat that you can add value to and get increased yield. Rather than finding issues with the bigger picture look at ways you can make money out of realestate.
It really is the easiest way to grow your wealth.
 
Given CBA's massive exposure to residential property loans and the likelihood that a recession could put them under severe pressure, you don't think they'd have any reason to present a particular bias in order to maintain confidence (if only as a facade to keep people buying their shares)?

re debt:


IMF-Mortgage-Debt-to-GDP.jpg

http://www.macrobusiness.com.au/2011/12/we-are-all-keensians-now/

The charts 3 years old, GDP has been steadily growing and housing finance stagnating, do you have figures relevant to today?
 
The charts 3 years old, GDP has been steadily growing and housing finance stagnating, do you have figures relevant to today?
Although growth in the mortgage market is at 35 years lows it is still growing faster than GDP, so I assume the mortgage debt to GDP ratio in Australia is higher now than in the chart above.

If you are interested you can check the figures for yourself.

RBA Lending and Credit Aggregates:
http://www.rba.gov.au/statistics/frequency/financial-aggregates.html

ABS GDP Figures:
http://www.abs.gov.au/ausstats/[email protected]/mf/5206.0


According to your friends at Macrobusiness in the same article they have private debt is stagnating since 2008 and we are "dis-leveraging".

http://www.macrobusiness.com.au/2011/12/we-are-all-keensians-now/

GDP is pretty much on trend.

You need to chart it off the same base, not just assume the percentage is now higher.

Extrapolating 1 years figures back 3 years is also completely misleading.
 
Last edited:
According to your friends at Macrobusiness in the same article they have private debt is stagnating since 2008 and we are "dis-leveraging".
http://www.macrobusiness.com.au/2011/12/we-are-all-keensians-now/
GDP is pretty much on trend.
You need to chart it off the same base, not just assume the percentage is now higher.
Extrapolating 1 years figures back 3 years is also completely misleading.
Who is extrapolating 1 years figures back 3 years? What are you talking about?

I posted a chart showing that our mortgage debt to GDP is high relative to other countries, you imply things have changed since 2009 (due steadily rising GDP, stagnating housing finance), but you are wrong (it's still around 85%)...

Re "dis-leveraging", they can call it whatever they like, the level of debt is still rising.
 
Last edited by a moderator:
Who is extrapolating 1 years figures back 3 years? What are you talking about?

I posted a chart showing that our mortgage debt to GDP is high relative to other countries, you imply things have changed since 2009 (due steadily rising GDP, stagnating housing finance), but you are wrong (it's still around 85%)...

Re "dis-leveraging", they can call it whatever they like, the level of debt is still rising.

Quite simply,you posted a 3 year old chart, to be up to date you need 3 years of statistics charted not 1 year as you linked to.
 
Last edited by a moderator:
Quite simply,you posted a 3 year old chart, to be up to date you need 3 years of statistics charted not 1 year as you linked to.
A) The 'Lending and Credit Aggregates - D2' spreadsheet on the RBA page I linked has mortgage data going back to 1990.
B) The downloads tab on the ABS page I linked has GDP data going back even further.
C) I didn't extrapolate anything.
 
Last edited by a moderator:
Back
Top