Potential negative gearing changes

I have seen stories about those working at the mines on a good wicket, earning $200k driving a truck or shovelling dirt and buying a bunch of negatively geared properties... I wouldn't call that professional or savvy investing without qualifying their situation further. I don't think the number of properties really dictates whether someone is a savvy buyer or not.
True.

If you are on $200k or more, and are sensible enough not to smash all of it on lifestyle and doodads, it would be too easy to rack up half a dozen properties without being really savvy...

You could save a fair whack of cash for a deposit on an IP each year, and each one could be pos geared or pos cashflowed from day one.

Doddle.
 
People working in the mines are buying pos geared property too. What does this mean?
My point wasn't to pick on those in the mining industry (or negative versus positive cash flow) it was to highlight that having a high income and the servicing ability to buy 6 properties doesn't make someone a savvy property investor by default.

I could sell all my other investment assets, pool my cash and buy 6 properties tomorrow (using loans), it wouldn't (necessarily) make me a savvy property investor either.
 
Sorry, but your anecdotal stories don't align with the data which shows investor activity often climaxes with price peaks.

You may think that every investor our there is a smart contrarian who doesn't get caught up in emotion and hype, but that's not the case.

If you are seeing more OO enquires, but investors are making a majority of purchases (which data would suggest is the case in NSW/Sydney), then perhaps that supports the suggestion from Wategos that investors are outbidding FHBs or OOs in general.

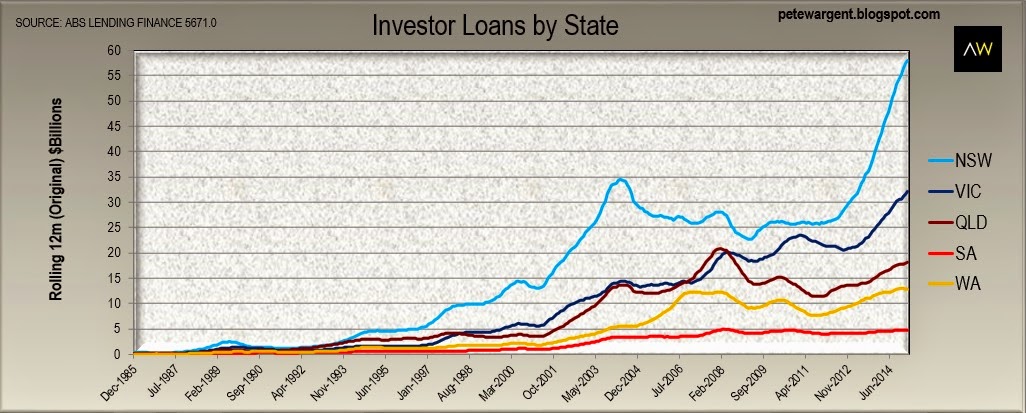
Note the major peak in investor finance at the same time prices peaked in Sydney (2003)...

http://petewargent.blogspot.com.au/2015/04/sydney-investor-loans-continue-to-power.html

LF1.jpg

I'm getting pretty sick of your charts.

Unless you aren't aware of it, NSW is made up of many markets. There are even markets within markets in Sydney. My comments were merely to highlight what I have seen in an affordable area where you often find both FHO and investors, not NSW in general and not even Sydney in general.

My comments were targeted specifically from what I am seeing in the lower priced suburbs of Western Sydney. Unless your charts are charting that particular area, then they aren't relevant to my comments.
 
Another thing to consider is that with the internet, it is no longer a scary prospect to own an IP, and there are many FHO's who buy a home to move into at a later date, but intend on it being an IP for a few years first, in order to pay some of the loan off.

So, for the purpose of statistics, these properties would fall into the category of IP's, but they are not going to stay that way. I know a couple of young singles who fall into that category.
 
My comments were targeted specifically from what I am seeing in the lower priced suburbs of Western Sydney. Unless your charts are charting that particular area, then they aren't relevant to my comments.
When you said "Yet more baloney!" to Wategos, did you think his comment was only in reference to the lower priced suburbs of Western Sydney?

You refuted his comments with an anecdotal story of your own. My facts & data were simply to backup his assertion that investors are having a strong impact on the market, particularly in Sydney/NSW.

No need to get narky for being wrong. We've all been there.
 
Most property bubbles around the world are primarily driven by speculators pushing up prices, Australia is no different as hobo-jos charts show.

In the US for example, the four states that had the biggest rises and subsequent crashes (Arizona, California, Florida, and Nevada) also had the biggest surge in investor activity, peaking at 45% of purchases, double the normal rate.
 
Rixter, this chart may interest you which shows both OOs & investors, but on a national scale (from http://www.theguardian.com/business...fuel-a-housing-bubble-on-the-edge-of-bursting).

CB4rVIkUAAA7pOA.png


You can see both buyer types are exuberant into price peaks at times e.g. 2003/2007. 2010 peak driven mostly by OOs due to increased FHOGs in period prior. This one is clearly being driven primarily be investors with their finance beating OOs for first time in history of the data series. OOs did contribute early in the run, but have flattened out now.

I doubt there is any data separating "professional" investors from others (what measure would you use to separate the two anyway), but just as there are savvy investors there are savvy OOs.

You neglected to point out that this data is flawed, a typical example of lies,damn lies and statistics.

Are first-home buyers really being priced out of the housing market?

It appears not ? not to the extent that we have been told anyway.

http://www.smh.com.au/business/prop...th-firsthome-buyers-data-20150204-1360tx.html
The chart I posted shows OOs vs Investors. Your article links refers to a problem that is specifically with First Home Buyer data, it doesn't affect the data in the chart I posted.

Nice try though.
 
When you said "Yet more baloney!" to Wategos, did you think his comment was only in reference to the lower priced suburbs of Western Sydney?

You refuted his comments with an anecdotal story of your own. My facts & data were simply to backup his assertion that investors are having a strong impact on the market, particularly in Sydney/NSW.

But you did it by quoting me! I'm not being narky, I'm letting you know that my comments and your chart do not go hand in hand.

If you are going to quote me, then post something relevant to what I'm talking about, not something based on the whole of NSW.

No need to be narky for being wrong, we've all been there.:p
 
The chart I posted shows OOs vs Investors. Your article links refers to a problem that is specifically with First Home Buyer data, it doesn't affect the data in the chart I posted.

Nice try though.

The article I linked to set out that from around Oct. 2012 FHB Stats were flawed with only counting FHB that claimed grants.

And as you have said

This one is clearly being driven primarily be investors with their finance beating OOs for first time in history of the data series. OOs did contribute early in the run, but have flattened out now.

With the chart you posted the data may be correct but the question being, is this chart misleading due to FHB purchasing a rental(and getting the benefit of Negative Gearing) to later turn the property into their first home.

As I said, lies,damn lies and statistics.
 
Again; I come back to our own lives as an indicator - how many folks on this forum know a significant amount of active and multiple IP owners within their circle of friends and relatives?

I personally know noone. I know a couple of folks who have ONE IP only.

I know a decent number who have a holiday house.

I also know some colleagues at my workplace who have an IP because they inherited Mum's old house and they are renting it out with no financial IQ whatsoever. In these cases the houses are unencumbered and not geared at all.
 
Rixter, this chart may interest you which shows both OOs & investors, but on a national scale (from http://www.theguardian.com/business...fuel-a-housing-bubble-on-the-edge-of-bursting).

CB4rVIkUAAA7pOA.png

You can see both buyer types are exuberant into price peaks at times e.g. 2003/2007. 2010 peak driven mostly by OOs due to increased FHOGs in period prior. This one is clearly being driven primarily be investors with their finance beating OOs for first time in history of the data series. OOs did contribute early in the run, but have flattened out now.

I doubt there is any data separating "professional" investors from others (what measure would you use to separate the two anyway), but just as there are savvy investors there are savvy OOs.
This would be purely subjective
Interesting graph but I don't think its reasonable to say that there are as many savvy OO. Purchasing a ppor requires careful thought sure but many people live where they want to live and will pay whatever they can afford to live in a particular suburb. This could be due to schools, living near family or friends or just to keep up with the Jones's, none of these reasons have to make economic sense and as such these purchasers will bid up desirable properties. Maybe I have been doing it all wrong but if I have to compete aggressively with OO in a market I will look elsewhere for a while, for most investors it has to stack up to some degree
 
Last edited:
Most property bubbles around the world are primarily driven by speculators pushing up prices, Australia is no different as hobo-jos charts show.
When you say "speculator" are you referring to those who do flips?

Or; is it just your derogatory term for all property investors who you seem to hate?

In my opinion, some "Mum and Dad" who buy a couple of IP's (and let's face it - this is the vast majority of IP owners according to stats - lees than 2 IP's) to help grow their wealth and fund their retirement is not a speculator - they are investors.

Back to flippers; they are in the business of buy low, do a reno, then sell high. Flippers do not force up the prices.

In the US for example, the four states that had the biggest rises and subsequent crashes (Arizona, California, Florida, and Nevada) also had the biggest surge in investor activity, peaking at 45% of purchases, double the normal rate.
When there is investor activity in any one area, this does not also mean that all the O'O's miraculously disappear and stop buying completely.

Investor activity will certainly increase when yields are high - but this is usually in areas where the CG has lagged behind rent increase for some time. (meaning noone at all has been buying there for any length of time).

So then; the investors start to buy - and you reckon they are forcing the prices up and cutting out the FHB's???

The FHB's were not even looking in those areas before this sudden interest; otherwise the CG would have seen a steady climb, no?

Plus; if there is a boom in that area - this applies to everyone; a boom attracts the herds who want to cash in and not miss out.
 
The 80K income figure is misleading and has been debunked, since it is AFTER their gross income has been reduced with property investment losses and depreciation. By far the biggest chunk of tax deductions is within higher income groups: the-myth-of-mum-and-dad-negative-gearers


Of course, Wategos, whatever. Teachers, retail staff, cleaners, hospitality and office personnel all earn over $80K, do they? I'm a Teachers Aide. I'll accept the ATO's own stats thank you.
 
The article I linked to set out that from around Oct. 2012 FHB Stats were flawed with only counting FHB that claimed grants.

And as you have said

This one is clearly being driven primarily be investors with their finance beating OOs for first time in history of the data series. OOs did contribute early in the run, but have flattened out now.

With the chart you posted the data may be correct but the question being, is this chart misleading due to FHB purchasing a rental(and getting the benefit of Negative Gearing) to later turn the property into their first home.

As I said, lies,damn lies and statistics.
Again, the link you posted has nothing to do with anything I've posted in this thread.

If someone is buying an investment property (that one day they might move into) they are not a First HOME Buyer (FHB), but they might be a First TIME Buyer (FTB). That doesn't take away anything from the fact that they are an investor for now and it's nothing new or changed, people have been doing this for years and we've never had any statistics to measure it.

It's more like lies, damn lies and turk's posts if you ask me.
I don't think its reasonable to say that there are as many savvy OO. Purchasing a ppor requires careful thought sure but many people live where they want to live and will pay whatever they can afford to live in a particular suburb. This could be due to schools, living near family or friends or just to keep up with the Jones's, none of these reasons have to make economic sense and as such these purchasers will bid up desirable properties. Maybe I have been doing it all wrong but if I have to compete aggressively with OO in a market I will look elsewhere for a while, for most investors it has to stack up to some degree
I only mentioned savvy OOs because some here were suggesting they were the only dumb money driving prices to an overvalued state, when it's obvious that investors buy heavily into peaks too. I agree that most OOs wouldn't measure up a property in the same way as an investor, but some would look for value and future growth potential, especially given the CGT free status and many of the facilities that an OO buyer look for would be the same as an investor (e.g. nearby schools, shopping, transport, etc).

When you say "speculator" are you referring to those who do flips?

Or; is it just your derogatory term for all property investors who you seem to hate?
I went to a property talk last night by Steve McKnight and he basically said anyone who buys a loss making property (i.e. negatively geared) is a speculator.
 
Well......if Steve McKnight says, it must be so. :rolleyes:

Where did I say that :confused:

Simply pointing out that not everyone who uses the label for property owners means it in a derogatory way. It's a subjective term.

I think Steve's view is a fair one though. If you negatively gear a property you are speculating on future price or rent growth to make a profit in the future, so how are you not a speculator?
 
Again, the link you posted has nothing to do with anything I've posted in this thread.

If someone is buying an investment property (that one day they might move into) they are not a First HOME Buyer (FHB), but they might be a First TIME Buyer (FTB). That doesn't take away anything from the fact that they are an investor for now and it's nothing new or changed, people have been doing this for years and we've never had any statistics to measure it.

It's more like lies, damn lies and turk's posts if you ask me.

It's not about what you posted in the tread it's about the chart in the thread, in that while the data can be correct it can also be misleading.

Good to see you agree with my point that there are no statistics to measure FHB that start out as investors then turn their investment into their first home.

Thanks for the personal abuse, you have maintained your consistency
 
Back
Top