Roy Morgan: Unemployment at record high 4Q14


Hardly. A poorly written and researched piece.

The problem with so called job adverts is that it's not correlated to actual unemployed numbers.

In Aug 14 there were 147,200 job vacancies though unemployment totalled 735,500 people.

So a small blip in job vacancy ads makes little or no difference to the employment numbers.

The problem at the moment is that job creation is not keeping pace with population growth and job destruction. AU needs something like 30,000 jobs created per month to hold steady.
 
RM provides a broader and deeper analysis of employment data than ABS stats
No they don't.

Roy Morgan surveys approx. 5,000 people each month.

The ABS surveys approx. 50,000 people each month.

So straight away we can see the ABS sample size is ten times that of Roy Morgan.

Also, the ABS provides a much more detailed analysis of the data, including all the tables listed below every month...

http://www.abs.gov.au/ausstats/[email protected]/mf/6202.0

Labour Force Commentary November 2014
what's new in the labour force
Independent Technical Review into the Labour Force Survey and ABS Response
Article Archive
About this Release
Labour Force, Australia (Media Release)
Explanatory Notes
Downloads
Table 01. Labour force status by Sex - Trend Download Excel File (772 kB)Download Zip File (405 kB)
Table 02. Labour force status by Sex - Seasonally adjusted Download Excel File (772 kB)Download Zip File (406 kB)
Table 03. Labour force status by Sex Download Excel File (873 kB)Download Zip File (462 kB)
Table 04. Labour force status by Sex - New South Wales - Trend, Seasonally adjusted and Original Download Excel File (718 kB)Download Zip File (373 kB)
Table 05. Labour force status by Sex - Victoria - Trend, Seasonally adjusted and Original Download Excel File (717 kB)Download Zip File (373 kB)
Table 06. Labour force status by Sex - Queensland - Trend, Seasonally adjusted and Original Download Excel File (717 kB)Download Zip File (373 kB)
Table 07. Labour force status by Sex - South Australia - Trend, Seasonally adjusted and Original Download Excel File (717 kB)Download Zip File (372 kB)
Table 08. Labour force status by Sex - Western Australia - Trend, Seasonally adjusted and Original Download Excel File (717 kB)Download Zip File (372 kB)
Table 09. Labour force status by Sex - Tasmania - Trend, Seasonally adjusted and Original Download Excel File (717 kB)Download Zip File (372 kB)
Table 10. Labour force status by Sex - Northern Territory - Trend and Original Download Excel File (461 kB)Download Zip File (234 kB)
Table 11. Labour force status by Sex - Australian Capital Territory - Trend and Original Download Excel File (461 kB)Download Zip File (234 kB)
Table 12. Labour force status by Sex - States and Territories Download Excel File (4393 kB)Download Zip File (1922 kB)
Table 13. Labour force status by Sex - Persons aged 15 to 19 years - Trend Download Excel File (617 kB)Download Zip File (318 kB)
Table 14. Labour force status by Sex - Persons aged 15 to 19 years - Seasonally adjusted Download Excel File (618 kB)Download Zip File (319 kB)
Table 15. Labour force status by Sex and Educational attendance - Persons aged 15 to 19 years Download Excel File (3917 kB)Download Zip File (1068 kB)
Table 16. Labour force status by Educational attendance, States and Territories - Persons aged 15 to 19 years Download Excel File (22480 kB)Download Zip File (4324 kB)
Table 17. Labour force status by Sex - Persons aged 15 to 24 years - Trend, Seasonally adjusted and Original Download Excel File (2099 kB)Download Zip File (1123 kB)
Table 18. Labour force status by Sex - Persons aged 15 to 64 years - Trend, Seasonally adjusted and Original Download Excel File (2081 kB)Download Zip File (1117 kB)
Table 19. Aggregate monthly hours worked by Employment Status and Sex - Trend and Seasonally adjusted Download Excel File (460 kB)Download Zip File (236 kB)
Table 20. Aggregate monthly hours worked by State - Trend and Seasonally adjusted Download Excel File (403 kB)Download Zip File (202 kB)
Table 21. Quarter measure of aggregate monthly hours worked by Industry Sector - Seasonally adjusted Download Excel File (170 kB)Download Zip File (84 kB)
Table 22. Labour underutilisation by Age and Sex - Trend, Seasonally adjusted and Original Download Excel File (1430 kB)Download Zip File (608 kB)
Table 23. Labour underutilisation by State and Sex - Trend, Seasonally adjusted and Original Download Excel File (1893 kB)Download Zip File (793 kB)
All Time Series Spreadsheets

With each of the spreadsheets covering information such as...

Employed - full-time ; Males ;
Employed - full-time ; Females ;
Employed - full-time ; Persons ;
Employed - part-time ; Males ;
Employed - part-time ; Females ;
Employed - part-time ; Persons ;
Employed - total ; Males ;
Employed - total ; Females ;
Employed - total ; Persons ;
Unemployed - looking for full-time work ; Males ;
Unemployed - looking for full-time work ; Females ;
Unemployed - looking for full-time work ; Persons ;
Unemployed - looking for part-time work ; Males ;
Unemployed - looking for part-time work ; Females ;
Unemployed - looking for part-time work ; Persons ;
Unemployed - total ; Males ;
Unemployed - total ; Females ;
Unemployed - total ; Persons ;
Labour Force ; Males ;
Labour Force ; Females ;
Labour Force ; Persons ;
Unemployment rate - looking for full-time work ; Males ;
Unemployment rate - looking for full-time work ; Females ;
Unemployment rate - looking for full-time work ; Persons ;
Unemployment rate ; Males ;
Unemployment rate ; Females ;
Unemployment rate ; Persons ;
Participation rate ; Males ;
Participation rate ; Females ;
Participation rate ; Persons ;
Employment to population ratio ; Males ;
Employment to population ratio ; Females ;
Employment to population ratio ; Persons ;
Unemployment to population ratio - looking for full time work ; Males ;
Unemployment to population ratio - looking for full time work ; Females ;
Unemployment to population ratio - looking for full time work ; Persons ;

Underemployed workers ; 15 - 24 ; Males ;
Underemployed workers ; 15 - 24 ; Females ;
Underemployed workers ; 15 - 24 ; Persons ;
Underemployed workers ; 25 - 34 ; Males ;
Underemployed workers ; 25 - 34 ; Females ;
Underemployed workers ; 25 - 34 ; Persons ;
Underemployed workers ; 35 - 44 ; Males ;
Underemployed workers ; 35 - 44 ; Females ;
Underemployed workers ; 35 - 44 ; Persons ;
Underemployed workers ; 45 - 54 ; Males ;
Underemployed workers ; 45 - 54 ; Females ;
Underemployed workers ; 45 - 54 ; Persons ;
Underemployed workers ; 55 and over ; Males ;
Underemployed workers ; 55 and over ; Females ;
Underemployed workers ; 55 and over ; Persons ;
Underemployed workers ; Total (Age) ; Males ;
Underemployed workers ; Total (Age) ; Females ;
Underemployed workers ; Total (Age) ; Persons ;
Underemployment rate ; 15 - 24 ; Males ;
Underemployment rate ; 15 - 24 ; Females ;
Underemployment rate ; 15 - 24 ; Persons ;
Underemployment rate ; 25 - 34 ; Males ;
Underemployment rate ; 25 - 34 ; Females ;
Underemployment rate ; 25 - 34 ; Persons ;
Underemployment rate ; 35 - 44 ; Males ;
Underemployment rate ; 35 - 44 ; Females ;
Underemployment rate ; 35 - 44 ; Persons ;
Underemployment rate ; 45 - 54 ; Males ;
Underemployment rate ; 45 - 54 ; Females ;
Underemployment rate ; 45 - 54 ; Persons ;
Underemployment rate ; 55 and over ; Males ;
Underemployment rate ; 55 and over ; Females ;
Underemployment rate ; 55 and over ; Persons ;
Underemployment rate ; Total (Age) ; Males ;
Underemployment rate ; Total (Age) ; Females ;
Underemployment rate ; Total (Age) ; Persons ;
Labour force underutilisation rate ; 15 - 24 ; Males ;
Labour force underutilisation rate ; 15 - 24 ; Females ;
Labour force underutilisation rate ; 15 - 24 ; Persons ;
Labour force underutilisation rate ; 25 - 34 ; Males ;
Labour force underutilisation rate ; 25 - 34 ; Females ;
Labour force underutilisation rate ; 25 - 34 ; Persons ;
Labour force underutilisation rate ; 35 - 44 ; Males ;
Labour force underutilisation rate ; 35 - 44 ; Females ;
Labour force underutilisation rate ; 35 - 44 ; Persons ;
Labour force underutilisation rate ; 45 - 54 ; Males ;
Labour force underutilisation rate ; 45 - 54 ; Females ;
Labour force underutilisation rate ; 45 - 54 ; Persons ;
Labour force underutilisation rate ; 55 and over ; Males ;
Labour force underutilisation rate ; 55 and over ; Females ;
Labour force underutilisation rate ; 55 and over ; Persons ;
Labour force underutilisation rate ; Total (Age) ; Males ;
Labour force underutilisation rate ; Total (Age) ; Females ;
Labour force underutilisation rate ; Total (Age) ; Persons ;
 
No they don't.

Roy Morgan surveys approx. 5,000 people each month.

The ABS surveys approx. 50,000 people each month.

So straight away we can see the ABS sample size is ten times that of Roy Morgan.

Also, the ABS provides a much more detailed analysis of the data, including all the tables listed below every month...

That's raw data not an analysis and sample size is not a measure of broadness or depth. That goes more to the questions asked and the quality of collection. ABS as mentioned has been taken to task on this.

I'm neither pro nor anti either system. They both have their shortcomings and limitations.

In relation to this thread they both concur relative to trend. That suggests there is some validity in defining the current direction of AU employment. At this point it's all down hill.
 
That's raw data not an analysis and sample size is not a measure of broadness or depth. That goes more to the questions asked and the quality of collection. ABS as mentioned has been taken to task on this.
Roy Morgan would be taken to task too, if they ever owned up to any issues. ABS is pretty honest when it comes to acknowledging and correcting errors. Roy Morgan is subject to very little scrutiny and is mostly ignored by economists and the press.

In relation to this thread they both concur relative to trend. That suggests there is some validity in defining the current direction of AU employment. At this point it's all down hill.

ABS down from 6.3% to 6.1%
 
The findings are sobering, and although there is a significant gap with the official (albeit very volatile) ABS figures, the trend is self-evident:

  • 1,402,000 Australians are looking for work (10.9% of the workforce, down 9,000 since December 2013);
  • 1,246,000 Australians are under-employed (working part-time and looking for more hours ? 9.7%, up 154,000 since December 2013).
  • 2,648,000 Australians are unemployed or under-employed ? a new record high (20.6% of the workforce, up 145,000 since December 2013);
  • After this month?s rise the latest Roy Morgan unemployment estimate of 10.9% is now a substantial 4.6% higher than the figure currently quoted by the ABS for November 2014 (6.3%).
When I pointed out a few months ago in some thread somewhere, that there was a growing trend in the West for jobs that were previously full time to be going part time, I was ridiculed and that there are plenty of full time jobs and always will be.

It appears also that unemployment is rising steadily for the last three years:

5966-quarterly.jpg
 
[/LIST]
When I pointed out a few months ago in some thread somewhere, that there was a growing trend in the West for jobs that were previously full time to be going part time, I was ridiculed and that there are plenty of full time jobs and always will be.

It appears also that unemployment is rising steadily for the last three years:

5966-quarterly.jpg

Unemployment will just go higher as more mines close. The trend looks pretty clear, even if only creeping up slowly with ABS stats.

Mining may not make up a lot of Aussie GDP but the bilions in Capex from big miners has lotsa flow on effects to rest of economy.

It will be interesting to see how things pan out in W.A.
 
wait - 94% of the country is employed and this is a bad thing?

not a bad thing at all considering some european countries with less % employed.

But a trend of increasing unemployment does to some extent reflect on how the economy is going and would probably have effects on the property market.
 
wait - 94% of the country is employed and this is a bad thing?

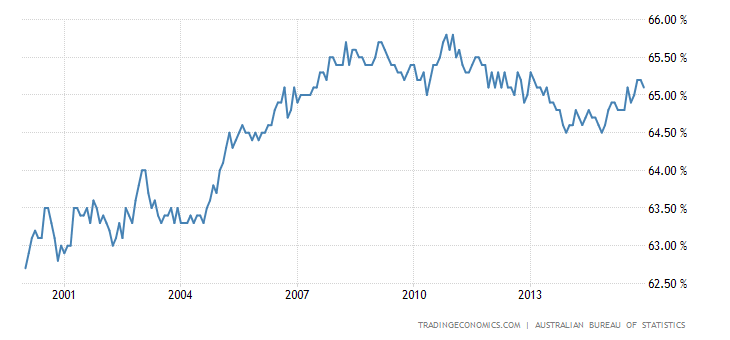
Wrong way of looking at it. The participation rate is a more realistic way of looking at employment and more difficult to fudge.

Australia Labor Force Participation Rate 1978-2015 | Data | Chart
Labor Force Participation Rate in Australia increased to 64.80 percent in December of 2015 from 64.72 percent in November of 2014. Labor Force Participation Rate in Australia averaged 63.11 percent from 1978 until 2015, reaching an all time high of 65.81 percent in November of 2010 and a record low of 60.23 percent in April of 1983

australia-labor-force-participation-rate.png


The trend isn't positive with a steady decline since 2010/11. The tail in the graph is an optimistic projection given the circumstances.
 
Got to say the rates look very good compared to the early 00s. As is always the case with stats they never tell the whole story. The participation rate is also under pressure from the ageing population. As people near retirement they participate less. I know it's one of the big goals on SS. Lol
 
The participation rate is also under pressure from the ageing population.

Billy Mitchell's blog supports your view

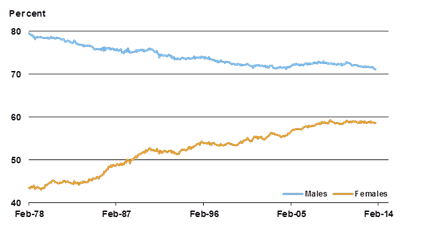
You might find this interesting. Are male participation rates declining because female labour is more competitively priced? The top graph suggests that female participation has peaked.

QG-LabourForce-2.gif


jericho---makeup-of-the-labour-force-2-data.jpg


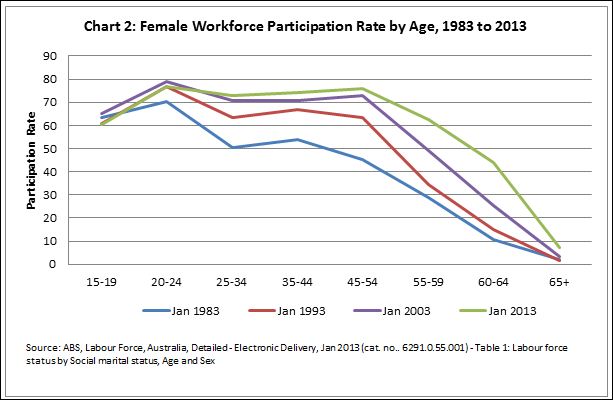
Their position has definitely improved albeit in a numerical sense over the last decade or so. They do seem to pull the pin and leave the workforce by their mid 50's though.

fa214-chart2.jpg


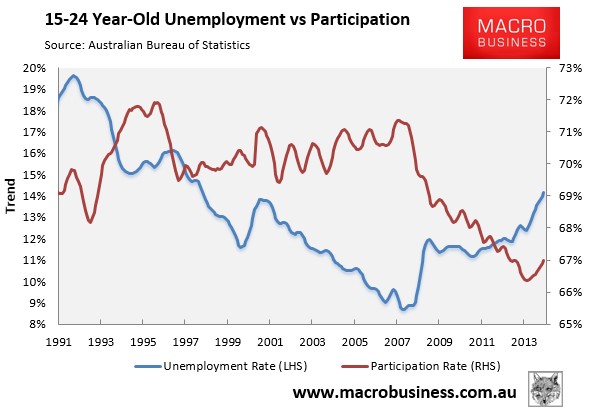
Youth (un)employment is a concern. I note that this trend appears global.

ScreenHunter_5425-Dec.-11-15.24.jpg
 
Youth unemployment is actually the bit that I find the scariest, for the simple reason that I think (Note: No science or research involved in this OPINION) that they're less likely to find work if and when the economy picks up, as they've never known otherwise. We also know that children of unemployed families are more likely to do the same
 
We also know that children of unemployed families are more likely to do the same

I have a young niece who starts her 4th year at high school this year. This year is a critical year in that outcomes determine access to uni. She had no intention of going to uni because her impression was that it was expensive and would leave her with a large debt. She has little understanding yet of the value of money and thought $20k debt would end in debt servitude for life.

I've slowly bought her around to the opportunities a degree offers, the financial payback of tertiary quals and the ease with which tertiary quals can be obtained. With a little virtual tour of academia she can now see how she can get a full time job (or near enough), live at home (distance learning) and do a Bach in Environmental Science (her preference is environmental management) in 3 years and a Masters in the 4th all by the time she's 21.

She originally wanted to drop out of high school at 17/18 and do the big OE. With a little bit of forward planning I've shown her how she can get a degree, be debt free and probably have a few dollars in the bank, be a lot more mature and do the OE with everything behind her. The OE could be used to hunt for international jobs, get a broader exposure to environmental issues on a global scale and use that to bolster her career prospects.

Throw in a business degree over her 20's and by the time she's in her 30's she has management career prospects as a real option. She's now re-enthused and as keen as mustard to do well at school this year.

The problem youngsters have today is that they have no experience to guide their decision making re their future. Unless someone shows them where the opportunities are, the possible headwinds and how to navigate their way into a realistic career pathway they're effectively stymied. Then there's her younger sister who I think regardless of any efforts on my part will still end up bagging groceries or pushing a mop. Sigh!
 
Good on you Freckle for helping your niece. I am not sure how or what is the best way these days, its dependent on the degree I guess, some probably wont be worth much?? I don't have any academic giants in my family, but that's OK as far as I am concerned.

I think the best thing you can do is provide support so kids can build confidence be positive, this is very powerful IMO, what I do with my kids, so far, fingers crossed working..
 
I have a young niece who starts her 4th year at high school this year. This year is a critical year in that outcomes determine access to uni. She had no intention of going to uni because her impression was that it was expensive and would leave her with a large debt. She has little understanding yet of the value of money and thought $20k debt would end in debt servitude for life.

I've slowly bought her around to the opportunities a degree offers, the financial payback of tertiary quals and the ease with which tertiary quals can be obtained. With a little virtual tour of academia she can now see how she can get a full time job (or near enough), live at home (distance learning) and do a Bach in Environmental Science (her preference is environmental management) in 3 years and a Masters in the 4th all by the time she's 21.

She originally wanted to drop out of high school at 17/18 and do the big OE. With a little bit of forward planning I've shown her how she can get a degree, be debt free and probably have a few dollars in the bank, be a lot more mature and do the OE with everything behind her. The OE could be used to hunt for international jobs, get a broader exposure to environmental issues on a global scale and use that to bolster her career prospects.

Throw in a business degree over her 20's and by the time she's in her 30's she has management career prospects as a real option. She's now re-enthused and as keen as mustard to do well at school this year.

The problem youngsters have today is that they have no experience to guide their decision making re their future. Unless someone shows them where the opportunities are, the possible headwinds and how to navigate their way into a realistic career pathway they're effectively stymied. Then there's her younger sister who I think regardless of any efforts on my part will still end up bagging groceries or pushing a mop. Sigh!

These days i think people can get ahead much quicker by avoiding university and getting a trade and jumping straight into the work force. Instead of racking up a 20k debt and missing out on 4 years of the workforce you can get a trade, (earn money while getting a qualification) and still be on a similar salary to someone with a standard degree. Im referring to more common place degrees like bachelor of commerce and arts etc, becoming doctors/lawyers etc is a different scenario but in general i think university is overrated.


"In all likelihood, this divergence can be explained by a higher than usual rate of job losses in the economy," he noted in the report.
SoundCloud: ANZ chief economist Warren Hogan discusses job ads with the ABC's Peter Ryan

"The good news is that the economy continues to produce new employment opportunities. The bad news is that this has not been quite enough to counteract the flow of new workers into the economy plus the on-going loss of jobs in certain sectors."
My reading of this is that the new employment opps are not necessarily "brand new" jobs, but a re-hashing of permanent jobs into part-time and casual jobs.

Speaking of this; the lady who came to our place yesterday is starting a new position as a teacher today. She is working 20 or so hours per week, but spread over the normal 5 day week. The school where she has gone to has only one full-time teacher and the rest are part-time. This of course will suit many of the women teachers who have kids.

Our friend has all school-aged kids now, so she would prefer to have all her hours crammed into less days, but this was not available.
 
Last edited:
Unless someone shows them where the opportunities are, the possible headwinds and how to navigate their way into a realistic career pathway they're effectively stymied

I'm in my mid 20s and doing good for myself now. However, when I finished uni (Economics degree with Hons) I couldn't find a job related to it at all. I spent about 9 months being unemployed before getting a job at a meat factory.

I've got a decent job now but it's still not related to my degree at all and the main barrier I've found is not the qualifications but having the experience. With the GFC employers didn't just sack people they cut back on all their training as well.

You end up with a catch 22 situation of 'can't get a job without experience, can't get experience without a job'. That's probably the best explanation for the current levels of youth unemployment. However, our political dinasours still seem to think that youth are unemployed because they are either lazy or uneducated.
 
I'm in my mid 20s and doing good for myself now. However, when I finished uni (Economics degree with Hons) I couldn't find a job related to it at all. I spent about 9 months being unemployed before getting a job at a meat factory.

I sympathise. It's a catch 22 in many ways. It's impossible at 16 to know what you are going to like or dislike in terms of a career yet you have to make choices about which direction to go. Difficulties increase the more specialised your education is. Then when you graduate you find the employment landscape has changed.

Specialisation is something I'm guiding my niece away from for the time being. A broader under grad qual can always be enhanced with additional studies/quals such as diplomas or additional degrees.

Then again you can always become a politician ;)
 
The problem youngsters have today is that they have no experience to guide their decision making re their future. Unless someone shows them where the opportunities are, the possible headwinds and how to navigate their way into a realistic career pathway they're effectively stymied.

Agreed. I did an engineering degree because I couldn't play sport for a living, and I didn't know what I wanted to do. Took until my late 20's to realise.

These days i think people can get ahead much quicker by avoiding university and getting a trade and jumping straight into the work force. Instead of racking up a 20k debt and missing out on 4 years of the workforce you can get a trade, (earn money while getting a qualification) and still be on a similar salary to someone with a standard degree. Im referring to more common place degrees like bachelor of commerce and arts etc, becoming doctors/lawyers etc is a different scenario but in general i think university is overrated.
I mostly disagree. In the immediate term, my mates who did a trade did pass me early on for earnings, but I have far greater earning potential upside. If you go for a trade, you need to plan your exit strategy!

I'm in my mid 20s and doing good for myself now. However, when I finished uni (Economics degree with Hons) I couldn't find a job related to it at all. I spent about 9 months being unemployed before getting a job at a meat factory.

I've got a decent job now but it's still not related to my degree at all and the main barrier I've found is not the qualifications but having the experience. With the GFC employers didn't just sack people they cut back on all their training as well.

You end up with a catch 22 situation of 'can't get a job without experience, can't get experience without a job'. That's probably the best explanation for the current levels of youth unemployment. However, our political dinasours still seem to think that youth are unemployed because they are either lazy or uneducated.
Doing good for yourself? I hope that didn't make it to your CV ;) :p I'm fortunate in that I can't understand what you've been through, but I can empathise with how frustrating that must have seemed. Did you look at moving locations?

I sympathise. It's a catch 22 in many ways. It's impossible at 16 to know what you are going to like or dislike in terms of a career yet you have to make choices about which direction to go.
Yup, and the people in the position to help you often aren't available.
 
Back
Top