Somersoft members may find these charts useful...
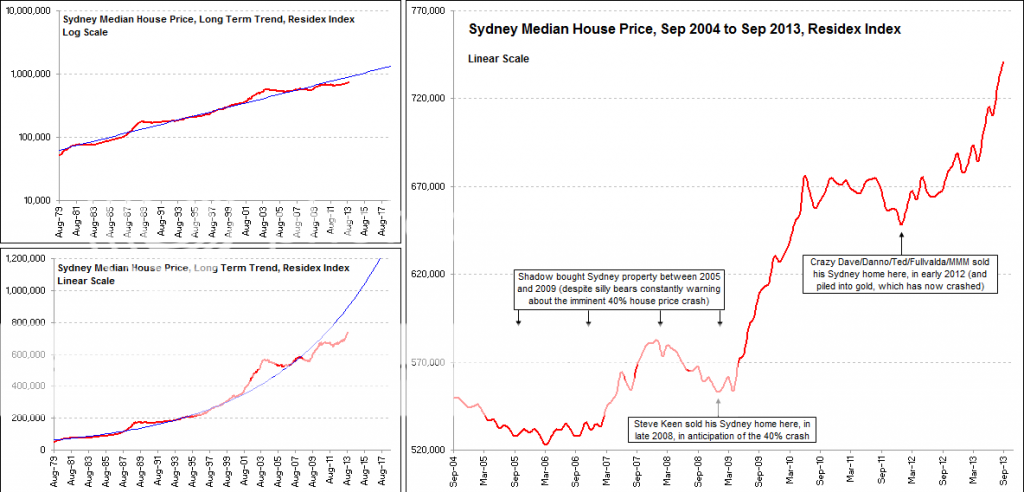
Sydney House Prices (Residex Index)
Sydney house price to income ratio (currently where it was back in 2002, over a decade ago.)
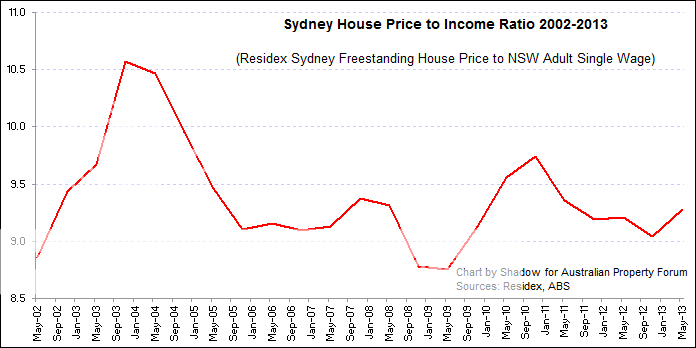
Note that the chart above is for freestanding houses to single income. The all-dwellings to household income ratio is around 6X rather than 9X.
Sydney Mortgage Repayment to Income Ratio
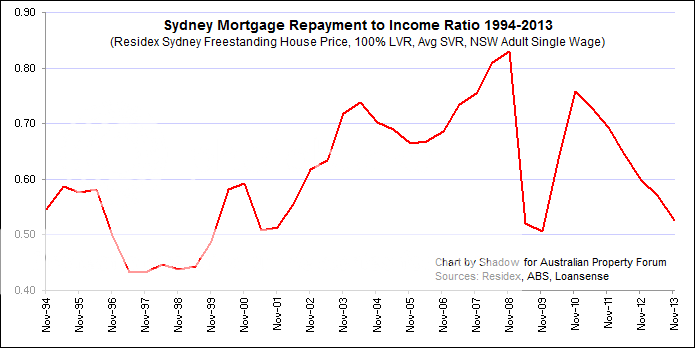
This chart uses historical mortgage rates to calculate the annual mortgage repayments on a Sydney median freestanding house as a proportion of the average single adult income, assuming the buyer borrows 100% of the house price (no deposit).
Amazingly, it would have taken more than 80% of a single adult wage to service a 100% LVR mortgage on a Sydney median house in 2008 (when the average SVR mortage rate hit 9.5%). This has dropped back down to just over 50% today, which is pretty much were it was in 1994.
So in terms of true affordability (mortgage repayments to income), Sydney is back to 1994 levels.
Imagine how high Sydney house prices could go if the mortgage repayment to income ratio rose back to 2008 levels under current interest rates.
Sources... loansense.com.au, residex.com.au, abs.gov.au/AUSSTATS/[email protected]/DetailsPage/6302.0May 2013
Sydney House Prices (Residex Index)
Sydney house price to income ratio (currently where it was back in 2002, over a decade ago.)
Note that the chart above is for freestanding houses to single income. The all-dwellings to household income ratio is around 6X rather than 9X.
Sydney Mortgage Repayment to Income Ratio
This chart uses historical mortgage rates to calculate the annual mortgage repayments on a Sydney median freestanding house as a proportion of the average single adult income, assuming the buyer borrows 100% of the house price (no deposit).
Amazingly, it would have taken more than 80% of a single adult wage to service a 100% LVR mortgage on a Sydney median house in 2008 (when the average SVR mortage rate hit 9.5%). This has dropped back down to just over 50% today, which is pretty much were it was in 1994.
So in terms of true affordability (mortgage repayments to income), Sydney is back to 1994 levels.
Imagine how high Sydney house prices could go if the mortgage repayment to income ratio rose back to 2008 levels under current interest rates.
Sources... loansense.com.au, residex.com.au, abs.gov.au/AUSSTATS/[email protected]/DetailsPage/6302.0May 2013