Sim
Administrator
Just thought I'd share some visitor statistics from last month - shows some interesting changes in how people access the site.
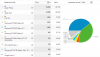
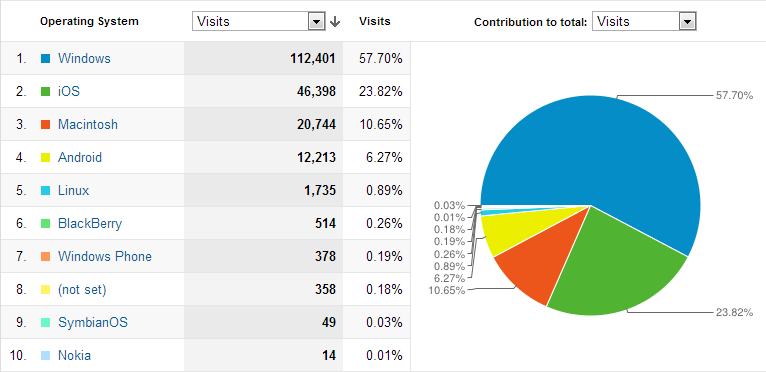
Operating System - Windows still dominant, but surprisingly, iOS now replaces MacOS as the #2 operating system.
Windows had 70% share in Jan 2012 while iOS didn't even feature in the list. MacOS has dropped about 1%
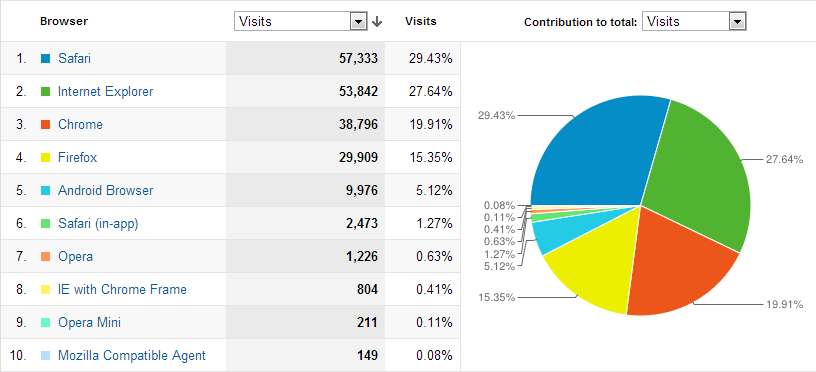
Browser - I find this one fascinating. In January 2012, Internet Explorer still had a clear lead with nearly 38% of the visits, followed by Safari on 22%, Firefox on 21% and Chrome on 14%.
Now Safari has the lead, despite the clear dominance of Windows - possibly a combination of more people using Safari on Windows (surprising), as well as mobile Apple devices reporting their OS as Safari I expect.
Not surprising that Firefox has dropped so much, but I though Chrome would have increased more. If Chrome was the default browser on Android (surprised it is not), then I think it's overall usage would be higher, including on Windows.
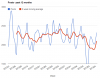
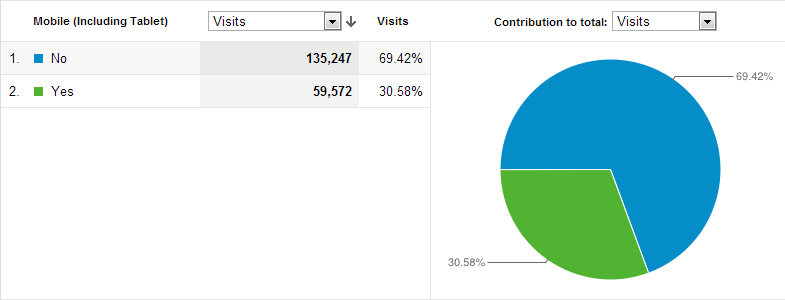
Mobile - this caught me by surprise. Nearly 31% of visits in January were on a mobile device or tablet ... then again, with the rise of so many good quality tablets providing a much more usable experience than smartphones, I guess it should be expected.
January 2012 saw only 17% of visits using a mobile device or tablet, January 2011 was only 7%. I think we can say that 2012 ended up being the year of the mobile device, a trend I expect will only continue in 2013.
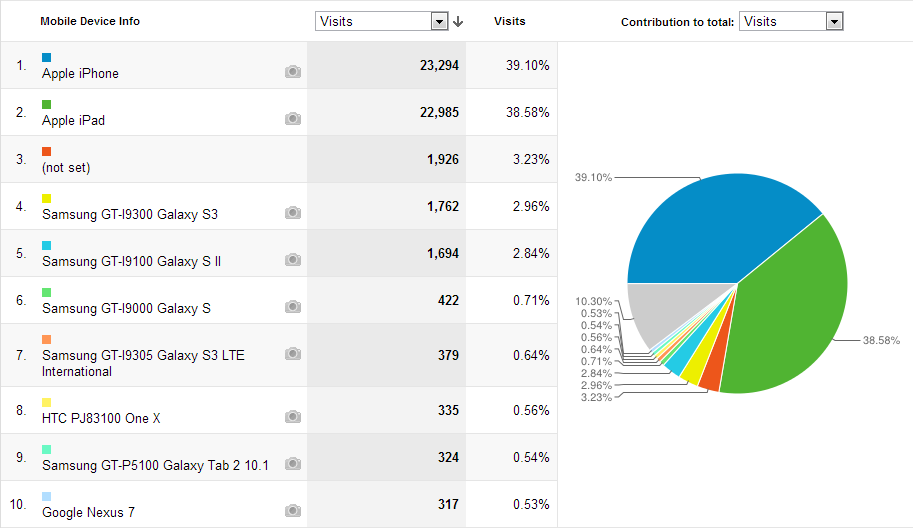
Mobile Devices - Apple iPhone and iPad continue their dominance, although interestingly, iPhone is down from January 2012 when it had 46% share, and iPad is only slightly up from 36%.
The big winner in growth is "Other"! While the Galaxy S2 and S3 are still the preferred alternatives, they haven't increased their overall share anywhere near as much as all the other devices that aren't in the top 10 ... in 2012 94.5% of visits were from the top 10 devices, but in January 2013, the others are now up to 10.3% ... which indicates to me a significant depth to the mobile device marketplace, with a lot of fragmentation still amongst the non-Apple market segment.
That being said, I counted 33 Samsung devices in the top 100 and 18 HTC devices, with no other device brand having more than 8 devices listed in the top 100. That does kind of fit with what I've been reading in the tech media about the popular devices - Samsung dominating the Android market with HTC trailing and nobody else even in the same ball park. I see very few non-Android devices in the list.
Operating System - Windows still dominant, but surprisingly, iOS now replaces MacOS as the #2 operating system.
Windows had 70% share in Jan 2012 while iOS didn't even feature in the list. MacOS has dropped about 1%
Browser - I find this one fascinating. In January 2012, Internet Explorer still had a clear lead with nearly 38% of the visits, followed by Safari on 22%, Firefox on 21% and Chrome on 14%.
Now Safari has the lead, despite the clear dominance of Windows - possibly a combination of more people using Safari on Windows (surprising), as well as mobile Apple devices reporting their OS as Safari I expect.
Not surprising that Firefox has dropped so much, but I though Chrome would have increased more. If Chrome was the default browser on Android (surprised it is not), then I think it's overall usage would be higher, including on Windows.
Mobile - this caught me by surprise. Nearly 31% of visits in January were on a mobile device or tablet ... then again, with the rise of so many good quality tablets providing a much more usable experience than smartphones, I guess it should be expected.
January 2012 saw only 17% of visits using a mobile device or tablet, January 2011 was only 7%. I think we can say that 2012 ended up being the year of the mobile device, a trend I expect will only continue in 2013.
Mobile Devices - Apple iPhone and iPad continue their dominance, although interestingly, iPhone is down from January 2012 when it had 46% share, and iPad is only slightly up from 36%.
The big winner in growth is "Other"! While the Galaxy S2 and S3 are still the preferred alternatives, they haven't increased their overall share anywhere near as much as all the other devices that aren't in the top 10 ... in 2012 94.5% of visits were from the top 10 devices, but in January 2013, the others are now up to 10.3% ... which indicates to me a significant depth to the mobile device marketplace, with a lot of fragmentation still amongst the non-Apple market segment.
That being said, I counted 33 Samsung devices in the top 100 and 18 HTC devices, with no other device brand having more than 8 devices listed in the top 100. That does kind of fit with what I've been reading in the tech media about the popular devices - Samsung dominating the Android market with HTC trailing and nobody else even in the same ball park. I see very few non-Android devices in the list.