
Interesting to see this article quoting RBA assistant governor (financial markets) Guy Debelle.
http://www.spionline.com.au/home/10823-australian-house-price-values-unlikely-to-drop-rba
http://www.spionline.com.au/home/10823-australian-house-price-values-unlikely-to-drop-rba
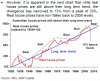
Australian house prices won’t plunge, a senior Reserve Bank of Australia (RBA) has said.

")