wow - mine's only 55 days interest free ....")
oh shhh you!
fixed now.

Follow along with the video below to see how to install our site as a web app on your home screen.
Note: This feature may not be available in some browsers.
wow - mine's only 55 days interest free ....
It suggests that most households are able to pay down their mortgage debt, which is why I said "better for those households in severe housing stress of course". Who's overstating the "picture of the stressed household P&L"? And who's saying that stretched households aren't cutting their repayments as mortgage rates fall?!? Fujitsu Consulting reckons there's "433,000 of those households likely to be in severe stress" - that's hardly a majority is it? $7.5B is a lot of money, but it could have been a lot more if all mortgage holders had done the same thing and not reduced repayments.One question, and a simple one at that...
If households are just using interest rate cuts to pay down their principal instead of reducing their repayments, what does this suggest about the ability of these households to service their current debt levels?
i.e. Wouldn't you think that "stretched" households would desperately follow the banks down with interest rate cuts and beg to allow their monthly repayments to reduce?
Somehow, the picture of the stressed household P&L seems overstated.
Debt servicability appears to be pretty good at present despite record price to income ratios. Funny that isn't it. Wouldn't have anything to do with all the things I've posted before around dual income families, rental yields, equity proportions, disposable incomes etc. Funny how that old metric of house price to individual income seems not to be able to accurately represent the true servicability picture any more...
Funny how times change and metrics lag or lose relevancy.
Cheers,
Michael
PS One other thing, when looking at servicability of your IPs you need to consider that you actually have "three" income streams servicing those debts: Yours, your tennants, and the governments. i.e. You put in a bit towards the interest, your tennant puts in a bit towards the interest and the government (via NG) puts in its bit. Again, funny how old metrics of take home pay vs property prices don't quite fit that neatly.
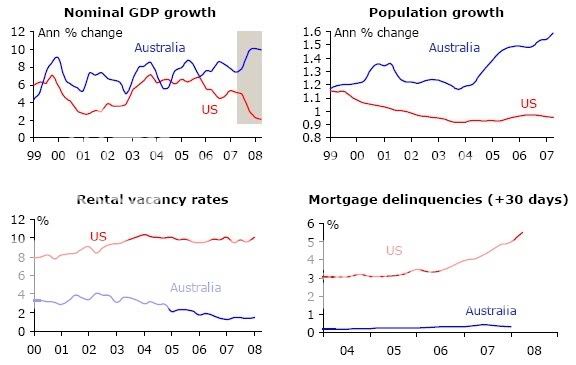
p). / looks at mortgage default levels in Australia.
That is the headline grabbing definition.....was reading an interesting article the other day regarding how "housing stress" is calculated.
apparently if more than 30% of net income is required to pay for accomodation than a household is considered in household stress. in the article this arcahic formula was being disputed (okay, by the banks), but it was succulently pointed out that with average consumerables (cars, tv, petrol, food, clothing etc) considerably lower in cost in comparison to average net income, the 30% law is no longer relevant.
for that that doubt me - cast your mind back to what items cost 20-30 years ago, in comparison to income and you will be enlightened.
...
For example, a typical household that in 1996 was devoting 30 per cent of its disposable income to debt servicing would today be able to devote 47 per cent of its disposable income to debt servicing while still having the same standard of living in terms of being able to buy other goods and services. This, broadly speaking, is the outcome that has occurred. It is not surprising, therefore, that some commentators who use a fixed benchmark for housing stress – such as housing repayments exceeding 30 per cent of income – are finding that more and more households are exceeding the benchmark.
I should also point out that the 30 per cent benchmark is sometimes applied more loosely than was intended by those who initially proposed it. The benchmark dates back to work done for the Australian Government’s 1991/92 National Housing Strategy. That work recommended that 30 per cent of income be adopted for the maximum level of housing costs for households in the bottom 40 per cent of the income distribution. Some commentators have since begun to apply it to all households, including those with very high levels of residual income. More generally, the rise in real incomes since the early 1990s has substantially changed the basis on which the 30 per cent benchmark was calculated.
Do you have a link ?Delinquency rates (> 30 days) as at Sept 08 for Australian issued RMBS was at a record high (1.47%) with Lo Doc sharply picking up to 3.90% (also a record)
Do you have a link ?
No worries. I think it's pretty clear that there's a sizeable proportion of mortgage holders who are able to increase repayments are live within their means, and are doing so now. The other debat I'm sure is alive and well in another thread.Hi DadOfSam,
Fair enough. Wasn't pointing the finger at you directly. Its just that a common theme that is run by the bearish posters is the unsustainability of our current debt levels. What I was pointing out is that current servicability responses seems to invalidate that argument.
i.e. If it was so unsustainable, how come households seem so able to readily switch to debt reduction when the sentiment changes?
Just a general observation and I'll make it again if I hear the "unsustainable debt levels" argument again...
Cheers,
Michael
Delinquency rates (> 30 days) as at Sept 08 for Australian issued RMBS was at a record high (1.47%) with Lo Doc sharply picking up to 3.90% (also a record)


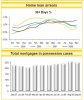
The chart below shows delinquency rates >30 days as being well under 1%. This chart only goes up to end of 2007 so I would be very interested to see your latest data showing the recent jump to 1.47%.
Cheers,
Shadow.
So it is different here, well, certainly appears to be anyway.
Has anyone got supporting evidence showing Australian defaults and vacancy rates as bad as the US?
Dave
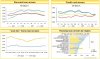
Commonwealth Banks own figures to Sept 2008 can be found here - page 24-26 show the graphs below. I'd guess CBA is fairly representative of the big 4, which have 80%+ of the market.Has anyone got supporting evidence showing Australian defaults ... ?
Shadow, me old son. My figures are RMBS at September '08 and from our friends at Moodys
it is relatively easy for banks to fudge arrears rates for stuff on their balance sheet, particularly if mortgage insurance isn't involved or they are using a captive, depending on what results they want to produce. The easiest and most common approach is to allow the borrower to capitalise their missed repaymets into the loan - arrears begone!
Shadow, me old son. My figures are RMBS at September '08 and from our friends at Moodys ( '07 is a different world...remember CBA and other coming out and saying the GCC won't effect them). Can't find it linked to a public site and posting it would be a breach of the terms of use of my account but I'll keep looking.
The reason that, in my experience, they (RMBS) are a better indicator of the real trends is that the reporting isn't provded by the org. that wrote the loans but those who now own the risk and have to report to their investors.
To be honest, it is relatively easy for banks to fudge arrears rates for stuff on their balance sheet, particularly if mortgage insurance isn't involved or they are using a captive, depending on what results they want to produce. The easiest and most common approach is to allow the borrower to capitalise their missed repaymets into the loan - arrears begone!
RMBS are all insured and capitalisation is a generally a no-no so the numbers can't be fudged and they are therefore a more honest indication of where things are going.
TF, me old dad, I doubt they're more reliable than the RBA. I think you're wrong, and since you can't even provide a link...
If the borrower is far enough below his loan limit to allow interest capitalisation, then he's not in arrears, is he. He is already ahead in his repayments.
You need to think more.
Cheers,
Shadow.