Install the app
How to install the app on iOS
Follow along with the video below to see how to install our site as a web app on your home screen.
Note: This feature may not be available in some browsers.
You are using an out of date browser. It may not display this or other websites correctly.
You should upgrade or use an alternative browser.
You should upgrade or use an alternative browser.
Capital City Monthly Price Indexes
- Thread starter Twitch
- Start date
More options
Who Replied?May not be overly relevant - is there a way to go beyond 1980,say 50 yrs? I think some crude stats are available.
How does one interperit the findings,
eg, 2.4867 in the month just gone, does that mean a rise of 2.5 percent on overall price for that month?
eg, 2.4867 in the month just gone, does that mean a rise of 2.5 percent on overall price for that month?
Spreadsheet attached with the lastest data, thanks to Residex. Headlines are Melbourne up 3.3% for the month (10.2% for quarter), Perth down 1.2% for month (but up 2.6% for quarter).
Another highlight is Sydney which has finally set a record price and exceeded it's previous peak from the last boom.
Enjoy")
Another highlight is Sydney which has finally set a record price and exceeded it's previous peak from the last boom.
Enjoy
Attachments
How does one interperit the findings,
eg, 2.4867 in the month just gone, does that mean a rise of 2.5 percent on overall price for that month?
No, those figures are indexes. It's probably best to just look at the prices tab in the spreadsheet.
May not be overly relevant - is there a way to go beyond 1980,say 50 yrs? I think some crude stats are available.
Sadly the old stats are 1) not by month and 2) not median values.
Spreadsheet attached with the lastest data, thanks to Residex. Headlines are Melbourne up 3.3% for the month (10.2% for quarter), Perth down 1.2% for month (but up 2.6% for quarter).
Another highlight is Sydney which has finally set a record price and exceeded it's previous peak from the last boom.
Enjoy
This is really useful, well done.
a suggestion, could you add graph(s) to this spreadsheet? i think it would be really helpful to see the price trends in a graphical form.
thanks
This is really useful, well done.
a suggestion, could you add graph(s) to this spreadsheet? i think it would be really helpful to see the price trends in a graphical form.
thanks
spreadsheet error
twitch
thanks go out for the ss however - i noticed in your formula for the prices they are referencing an end index of line 390 instead of the last line which should be 395 in your spreadsheet, your numbers are all slightly out,
correct me if i'm wrong, but the current prices should only be referenced to the lastest index in your case 31st october 2007, not 5 months previous,
can you confirm?
Summary of APR and years to double price from Residex Data
from that same residex data,
shows the 7-10years to double price - is a great barometer
note: 2008 is prices listed as 1/1/2008, the full 2008 is not included obviously
see attached pdf
from that same residex data,
shows the 7-10years to double price - is a great barometer
note: 2008 is prices listed as 1/1/2008, the full 2008 is not included obviously
see attached pdf
Attachments
Probably the most useful thread on this forum..thanks for the info...
I see that for a few months in late 1995 and early 1996 Darwin houses were the second most expensive of any capital city (Sydney the most expensive). This coincides with my first brief visit to Darwin (I was amazed at how expensive property was at the time)
Then from December 03 to March 05 Darwin was the cheapest capital city (behind Hobart).
Now Darwin prices are climbing again about to nudge Brisbane out. Very counter-cyclical performer is Darwin.
Ajax
Then from December 03 to March 05 Darwin was the cheapest capital city (behind Hobart).
Now Darwin prices are climbing again about to nudge Brisbane out. Very counter-cyclical performer is Darwin.
Ajax
Very counter-cyclical performer is Darwin.
Ajax
Interesting.
If you had property in Sydney then it might pay to pick up a cheapie on Darwin during the next Syd property boom...
If what you were after was to diversify. Of course the more diversified your portfolio the less you feel the impact of a large gain in value at one point.
TB
2007 is over and the results are in....
Enjoy.
It would be remiss of me to not at least mention Melbourne had the largest increase of any capital city for 2007 9% for the Dec quarter and 24% for the year.
Enjoy.
It would be remiss of me to not at least mention Melbourne had the largest increase of any capital city for 2007
9% for the Dec quarter and 24% for the year.The formula is correct, however there is a very small rounding error in the prices as the indexes only have 4 decimal places. The other thing that causes the difference is that Residex round the value $ figures off to the nearest $500.twitch
thanks go out for the ss however - i noticed in your formula for the prices they are referencing an end index of line 390 instead of the last line which should be 395 in your spreadsheet, your numbers are all slightly out,
correct me if i'm wrong, but the current prices should only be referenced to the lastest index in your case 31st october 2007, not 5 months previous,
can you confirm?
Unfortunately there is a 100kb file size limit and even without graphs and zipped up it's 99KbThis is really useful, well done.
a suggestion, could you add graph(s) to this spreadsheet? i think it would be really helpful to see the price trends in a graphical form.
thanks
Attachments
Last edited:
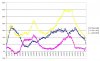
City Median Value Premiums
I like this chart
It shows premiums between Bris, Syd, Mel. So for example, the blue line charts what % premium the Sydney median value has been historically to the Melbourne median value.
At the moment Sydney has the smallest premium compared to Melbourne for 20 years. For Brisbane vs Sydney it's the smallest in 30 years.
This means in relative terms (ie compared to Melb & Bris) Sydney looks cheap now.
Enjoy.