Ah well
There are lies, damn lies - and then, there are statistics!
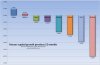
The graph looks great, truly shocking and alarming
But the 'worst' result was an overall loss of 6% for an area which saw significant and multiple natural disasters
In my post code, 6% is the usual discounting factor, so is considered a negotiating margin more than a drop in value. For Brisbane median to be 6% less than the previous record period I would see as only to be expected.
According to data on Invest Smart, the eg Armadale median dropped 2% in the 12 months to January 2011 – however, the median then was $1,480,000 – hardly an impoverished suburb, and over the 3 year period, the median had increased by 36% overall. This would indicate that the growth in the 36 – 24 month period must have been phenomenal and amounted to hundreds of thousands of dollars per property!
However, as a Broker I agree that the previous 12 months has been lean, but the previous 3 years has been surprisingly fat.
I have known 3 year periods with no capital growth but these past 3 years, despite the GFC, have shown strong growth just about across the board.
So while I enjoy looking at graphs and charts as much as the next person, and I do not doubt that there are some areas of Australia which are in decline due to a number of factors, overall it still comes down to the individual property and the market appeal of that property.
And if you, the vendor, is selling the Family Home after 40 years, and you bought it in 1971 for $25,000 and are selling it now for $625,000, I don’t think that a couple of percentage points here or there will cause you to lose any sleep
Cheers
Kristine