I came across the image below recently, and thought it may be of interest to some.
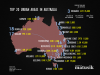
It lists Australia's largest urban areas, their current populations and change in population over the previous year.
Whilst much of this may not be new information to many, it is however (I feel), interesting to see it all collated in a single picture which may in turn make it easier to connect some further dots.
Aspects which I found of interest were:
Keen to hear your thoughts. What do you draw from this (if anything)? Or is trying to draw conclusions or insights without fully considering causality a dangerous path to tread?

It lists Australia's largest urban areas, their current populations and change in population over the previous year.
Whilst much of this may not be new information to many, it is however (I feel), interesting to see it all collated in a single picture which may in turn make it easier to connect some further dots.
Aspects which I found of interest were:
Whilst Brisbane on it's own is Australia's 3rd largest urban population centre, is also within commutable distance (IMO) to the nation's 6th and 9th centres. Combined, they have approximately 3.2M in the region.
-
Melbourne's population growth rate is significantly higher than Sydney's (not really a secret). However, what does this mean for housing in these cities? As Melbourne sprawls east, surely there is a need to start building up it's west. In 20 years, once Melbourne's population overtakes Sydney's, will we see a shift of large businesses down south, further accelerating its growth?
Ballarat and Bendigo really are small fry. Slightly larger than Albury, and smaller than Toowoomba, but often (in my perception anyway) are touted far more highly and favourably (presumably due to their proximity to Melbourne). Does this merit some re-focusing some more attention toward Toowoomba/Albury?
Perth and Adelaide, whilst capital cities are isolated in a sea of land. Do they have sufficient critical mass (in population, economic activity, investment, etc) to continue propelling themselves forward (in terms of capital growth)? Or should we focus more on areas like Wollongong and Geelong, which whilst much smaller, may at least reap the benefits of being near other large cities?
Keen to hear your thoughts. What do you draw from this (if anything)? Or is trying to draw conclusions or insights without fully considering causality a dangerous path to tread?