US: 10 Highest Rental Vancancy Areas

USA Vacancy Rates

Yep, USA national rental vacancy rate is above 10%. Many cities are well above 15%. Some above 20%.

But the gloomers told me we're just like America and that our 'over building' was just as bad. :confused: :D

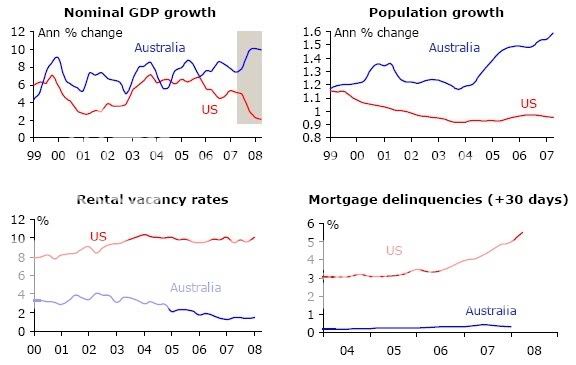
USvsAustraliaCharts1.jpg


USvsAustralia2.jpg


Cheers,

Shadow.
 
Just saw this on cnbcasia.
http://www.cnbc.com/id/29350086

Not sure how accurate it is, but its eye opening none the less. How are they going to put a floor under falling property prices with such high vacancies.

did anyone bother to check the way vacancy are measured in Australia and US? and what are the differences and how they effect the number in this GFC?
here you can find the US data collection method:
Computer-assisted telephone and personal visit interviews. All units in sample are visited if a telephone interview is not obtained.

The CPS/HVS is a voluntary survey.
In Australia you get the sqm research:

The rental listings component is based on all monitored and unique listings for the period of a calendar month. The series starts off in January 2005.


We then monitor all residential listings for each month and create three columns. 1) New listings added for the month..2) Listings withdrawn for the month and current listings as at the very end of the month.


A reconciliation is conducted with the number added, number withdrawn and the previous current listings.


All listings are taken from online monitoring of major listings sites. Only those properties with unique addresses are used. Those advertisements with no addresses are excluded from the series. Any addresses repeated between the two sites are de-duped.

Finally, only those listings that have been advertised for two weeks or more (and are still currently advertised as at the time of collation) are used.

Established Dwellings

We use the 2006 No. of total established Dwellings (as a base) by postcode as determined by the ABS census. In addition we estimate total dwellings for 2005, 2007 and 2008. We then multiply this by the percentage of renters for each postcode as also provided in the census. This provides an estimated available total stock for rent.

The numerator is then divided into the denominator, which provides a vacancy rate percentage.
also you have the RE industry data which is the one the industry flag around in the media and is just some RE agent reporting their vacancy rate on the listing).
In any case, what is the difference the GFC make to vacancy rates because of the methodology?
Using logic I think in US when homes are for sale (and usually empty) they are still classified vacant, in Australia when homes are for sale they are not listed vacant.
So rising inventory increase vacancy rate in US while reduce vacancy rate in Australia :eek:
Anyway, the big picture is still that because rising unemployment in US people are sqeezing in homes more and more, this won't happen in Australia if unemployment is ok. I also think in Australia there is no overbuilding like in many other country (that is different then say undersupply ;) )
 
i would have thought detroit would be higher than tied 10th at 4.0%

highest in this report is Orlando at 7.3%.

i wonder how you calculate rentals based on that data? if tenants have 7% more properties to choose from, does that make your rent 93% of what the last leases price was?
 
Back
Top