Australian house prices in the black for 2012

Very interesting results from the new daily price index.

Australian home values are now in the black for the first time in 2012, having fully recovered from the drop recorded during the seasonally-weak month of January.

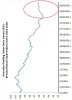
At 10 April 2012 home values across the eight capital cities had risen by 0.3% above their end 2011 levels (see first chart below).


joyebanks4101.jpg


link to article
 
.3% in 3.5 months is in the black? Maybe nominally, but in real terms (inflation taken into account) they are still falling. Is 1.2% a year enough to offset the heavy losses incurred by the many negatively gearing properties with the hope that capital gains exceeds their losses? I think not for most.

Let's see how things track over the year... measuring prices over a couple of months or even daily is just ridiculous IMO.

coupled with debt deflation and with the possibility of a higher kick up in growth it's getting pretty close tho
 
Ahhh I don't think anyone can tell anything from that tiny percentage in that tiny amount of space. Someone bored at work perhaps? They may as well throw a few meetings in there while they're at it.
 
The problem with these graphs is the type of properties and volume of said properties can distort the figures.

For example; yer average Mum and Dad may be struggling to get by, the Banks are still being tight post-GFC so these Mum and Dad (and below) would-be buyers don't qualify for lending. No lower end homes selling.

Meanwhile, the higher end/more attractive would-be purchaser at the Bank with cap in hand gets the nob more readily post GFC.

Presto! a lot more McMansions sell than yer triple fronted 3 bedder in burb-land and house prices have gone up.

The most reliable indicator is yer average family home in the neighborhood; see what it sold for 5 years ago, and what it's selling for today.
It's not based on median figures BayView, much closer to your last comment about looking at a specific standard home. Rismark/RPdata don't release their methodology for the daily index but I think it's probably just a twist on their hedonic approach.

Prefer the monthly residex index myself which is also not median data, excellent and free resource.

Chris Joye on calculating house prices
 
More specifically straight from the daily index site.

The indices are calculated using a hedonic methodology. The hedonic approach to price index construction accounts for the components contributing to a product's price. In the case of a residential property these components include the number of bedrooms and bathrooms, location, size, and other attributes. By separating each property comprising the index into its various formational and locational attributes, differing observed sales values for each property can be separated into those associated with varying attributes and those resulting from changes in the underlying residential property market.. Also, by understanding the value associated with each attribute of a given property, this methodology can be used to impute the value of dwellings having a certain set of characteristics (but no current sales price) by observing the sales prices and characteristics of other dwellings that do have recent sales prices. It then follows that changes in the market value of the stock of residential property comprising an index can be accurately tracked through time.
daily index data
 
Well Brisbane is back in the black after a strong month as well, will be interesting to see the results of the interest rate cuts on the market.

http://www.allenrealestate.com.au/wp-content/uploads/2012/04/brisbane-score-board-mar-12-300x263.jpg
larger pic
According to RP Data daily index the gain in March is already offset by a similar fall in April... treading water at best it seems:
http://www.macrobusiness.com.au/2012/04/australian-housings-poor-april/#comments
 
Some of us dont give a hoot about what the housing market is doing in Melbourne, Sydney, London, the US or the median price for "Australia". I just care about what is happening in Brisbane. Going up less than one percent sure beats going down, down and downer.
 
errr not sure if that post was aimed at me Angel, but I was referring to Brisbane. RP Data shows a fall in Brisbane over April.
 
Back
Top