
http://www.smh.com.au/news/national/...351125207.html
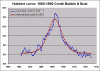
"The general manager of Australian Property Monitors, Michael McNamara, said he coined the term "peak debt" to echo the "peak oil" theory, which suggests the production of oil has peaked and is running out. Likewise the capacity to borrow will simply run out, he claims."
He is being "economical with the truth". After I found that the Hubbert Curve, the derivative of the logistic curve (and made famous by geophysicist Hubbert in relation to "Peak Oil"), fitted the Aus debt to income curve well, on searching the internet I found others had coined the phrase "Peak Debt" about a year earlier.
You can see the discovery and evolution of the idea here (when Cracker works):
http://cracker.com.au/viewthread.asp...tegoryid=11061
Note that:
"cracker.com.au is owned and operated by Fairfax Digital, a subsidiary of John Fairfax Holdings",
and Michael McNamara works for:
"Australian Property Monitors, a property analysis group owned by the publisher of the Herald, Fairfax Media".
-------------------------------------------------------------
You can draw these graphs yourself from publicly available data.
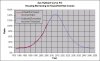
The first graph entitled "Aus Hubbert Curve Fit : Housing Borrowing to HouseHold Net Income" uses:
-----------------------
D02 LENDING AND CREDIT AGGREGATES>Credit, of which>Housing>(incl securitisations)
http://www.rba.gov.au/Statistics/Bulletin/D02hist.xls column L
divided by:
G12 GROSS DOMESTIC PRODUCT - INCOME COMPONENTS>Household income and outlays>Receipts>Total household income
http://www.rba.gov.au/Statistics/Bulletin/G12hist.xls column Q
(Both quantities expressed in [conveted to] in $ per year.)
----------------------
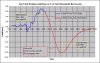
The ratio of Credit / Income is fitted with a Hubbert Curve (http://en.wikipedia.org/wiki/Hubbert_curve) using non-linear regression (minimization of the sum of squares of the difference between actual and predicted values) of the curve parameters:
Bottom: base of the curve
Height: top of curve minus base
Offset: year at which curve peaks
Stretch: half width of the curve at inflection point
The predicted values at each Year are calculated as:
=Bottom+(4*Height)*EXP((-Year+Offset)/Stretch)/((1+EXP((-Year+Offset)/Stretch))^2)
"The general manager of Australian Property Monitors, Michael McNamara, said he coined the term "peak debt" to echo the "peak oil" theory, which suggests the production of oil has peaked and is running out. Likewise the capacity to borrow will simply run out, he claims."
He is being "economical with the truth". After I found that the Hubbert Curve, the derivative of the logistic curve (and made famous by geophysicist Hubbert in relation to "Peak Oil"), fitted the Aus debt to income curve well, on searching the internet I found others had coined the phrase "Peak Debt" about a year earlier.
You can see the discovery and evolution of the idea here (when Cracker works):
http://cracker.com.au/viewthread.asp...tegoryid=11061
Note that:
"cracker.com.au is owned and operated by Fairfax Digital, a subsidiary of John Fairfax Holdings",
and Michael McNamara works for:
"Australian Property Monitors, a property analysis group owned by the publisher of the Herald, Fairfax Media".
-------------------------------------------------------------
You can draw these graphs yourself from publicly available data.
The first graph entitled "Aus Hubbert Curve Fit : Housing Borrowing to HouseHold Net Income" uses:
-----------------------
D02 LENDING AND CREDIT AGGREGATES>Credit, of which>Housing>(incl securitisations)
http://www.rba.gov.au/Statistics/Bulletin/D02hist.xls column L
divided by:
G12 GROSS DOMESTIC PRODUCT - INCOME COMPONENTS>Household income and outlays>Receipts>Total household income
http://www.rba.gov.au/Statistics/Bulletin/G12hist.xls column Q
(Both quantities expressed in [conveted to] in $ per year.)
----------------------
The ratio of Credit / Income is fitted with a Hubbert Curve (http://en.wikipedia.org/wiki/Hubbert_curve) using non-linear regression (minimization of the sum of squares of the difference between actual and predicted values) of the curve parameters:
Bottom: base of the curve
Height: top of curve minus base
Offset: year at which curve peaks
Stretch: half width of the curve at inflection point
The predicted values at each Year are calculated as:
=Bottom+(4*Height)*EXP((-Year+Offset)/Stretch)/((1+EXP((-Year+Offset)/Stretch))^2)
Attachments
Last edited:
