Hi Steve,
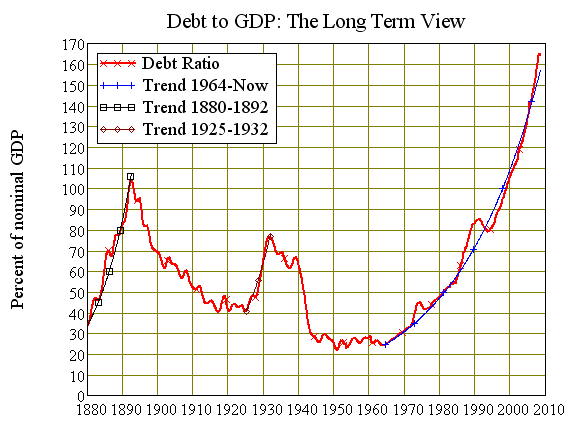
Regarding your Debt to GDP chart...
Credit growing faster than GDP is not necessarily a problem. GDP is income received each and every year, while credit is an expense that is only paid once. It makes more sense to either chart GDP against the interest on the debt, or to chart total debt against total assets.
GDP is not really comparable to total credit. If my income rises by $100 and my total debt rises by $110 then even at an interest rate of 10% pa, I'm still ahead by $89 (100 - (0.1 x 110)), even though my total debt has increased at a faster rate than my income. The same analogy applies to Australia's Credit vs GDP ratio.
Also, although the interest on the total credit must be paid every year, not all of this credit is owed to foreigners, so to some degree we are paying the interest to ourselves. From the perspective of the overall economy, debts are not just negative assets. They simply represent a pledge to transfer funds from one person to another at some future point in time. They are as much an asset to the lender as they are a liability to the borrower.
An important point about Australia's debt is that it's all private debt. Private individuals choose to borrow or not as they wish. It's their own personal debt, not the governments, not yours, not the average Australians. The people most able to handle this debt, are those people who took on the debt. The Australian government is free of debt.
In short, Australia's credit vs GDP ratio is not necessarily a problem.
And the RBA agrees...
http://www.rba.gov.au/Speeches/2007/sp_dg_250907.html
Has the expansion of household credit run its course? Will it reverse?
We cannot know the answer to these questions with any certainty, but my guess is that the democratisation of finance which has underpinned this rise in household debt probably has not yet run its course.
In the past, the lack of access to credit had resulted in Australian household sector finances being very conservative. Even as recently as the 1960s, the overall gearing of the household sector (taking account of all household debt and all household assets) was only about 5 per cent – that is, households owned 95 per cent of their assets, including houses, outright. This meant that the household sector had significant untapped capacity to service debt and large unencumbered holdings of assets to use as collateral for borrowings. Financial institutions recognised this and found ways to allow households to utilise this capacity.
The increase in debt in recent years has lifted the ratio of household debt to assets to 17½ per cent (Graph 6)3. I don’t think anybody knows what the sustainable level of gearing is for the household sector in aggregate, but given that there are still large sections of the household sector with no debt, it is likely to be higher than current levels.
I agree with the RBA, that Australia's debt to GDP ratio can continue along the present trend for quite a bit longer. I accept that it can't go on like this 'forever'. But then again, the sun won't burn 'forever'.
Cheers,
Shadow.

")