
Install the app
How to install the app on iOS
Follow along with the video below to see how to install our site as a web app on your home screen.
Note: This feature may not be available in some browsers.
You are using an out of date browser. It may not display this or other websites correctly.
You should upgrade or use an alternative browser.
You should upgrade or use an alternative browser.
altona, newport, yarraville VIC
- Thread starter oliver
- Start date
More options
Who Replied?rented in altona for a while; it is slowly starting to get better, pier street, doesn't look the best but a few more upmarket cafe's opened in the last few months.
yarraville is definately the most trendy of the 3, but quite expensive now, alot of the properties are underpriced, stay off williamstown road; around cruickshank park is nice and close to village, the road through the village, anderson st is small busy and quite claustrophobic (spelling)
as usual i reckon look at nice quiet streets, within 10mins of train station.
yarraville station is quite busy in the morning, but then again you only have 20min standing and your in flinders.
Properties in altona closer to the beach are very expensive, 1mill+ especially on the esplanade, doesn't compare to the east though.
Queen st in altona is very busy, and is the main road to point cook and altona meadows, i would avoid.
Altona has a tuesday market, yarraville has nice cafe's and bottle shop,
Newport, not sure, getting more expensive, i dont like the proximity of the station, usually a few kids hanging around here.
All are Zone 1 and withing 30mins on train to CBD.
unfortunately all of these suburbs are quite close to heavy industry, petrochemical etc.
you may get more property for your money in Altona than yarraville. look for quiet side street, close to beach and station.
also do a search on here there have been previous discussion on west
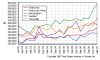
I have (historical) Median House Price figures and gains over last 10 years...(courtesy of Victorian Valuer-General).
Altona: 1994: Median House Price: $113,500.......2004: MPH: $330,000....change of: 191%
Altona North: 1994: $104,500..........2004: $284,000.......172%
Newport: 1994: $117,000.............2004: $370,000..........216%
Yarraville: 1994: $104,000............2004: $345,005.........232%
I don't have any IP's in these areas....and I know very little about them apart from the access to Victorian Valuer-General stats.
Just remember, Altona is the last seaside suburb in Melbourne in the westerly direction. I imagine that this could well push growth up as people may come here who want to live in a seaside suburb, but can't afford the other ones.
Funny thing is, I'm sitting right in the middle of one of those petrochemical companies as I type.
Funny thing is, I'm sitting right in the middle of one of those petrochemical companies as I type.
Hi,
I live in Altona Meadows. (17kms from the city). Altona is a very scenic location with a railway line to the city. (Via Newport, Yarraville, Footscray, Kensington, Nth Melbourne).
Interestingly more residential developments are taking place in Altona - people are buying old houses, knocking them down and building trendy town houses. The cafe strip in Pier Street is alive and well. I am not sure what type of tenant the area attracts, but there are some large blocks of land with small houses on them that could prove interesting. (Around the $400 mark I think - I am not very familiar with pricing in this area, as I don't follow it carefully).
The demographics appears to be people with young families. Many people who work in the city live in the area and take the train in.
I have an investment property in Altona Meadows. The tenant pays on time and looks after the house. She has been there for 3 years now. Altona Meadows has grown substantially over the past 10 years. It now has a large library (in a brand new building) and a substantial shopping centre with Coles, Big W and smaller shops. The area is convenient to the Train Station and in Zone 1. Also has excellent freeway access, and the car trip off peak takes between 15 and 20 minutes.
House prices are still very reasonable considering it's relative close proximity to the city.
We have lived in the area for 9 years, and enjoy it's central location.
Hope this helps a little.
Regards Jason.
Two things of note about those stats
1) the relative order in values were unchanged in 10 years
2) the more expensive the suburb the greater the growth rate
I can't see any reason why history won't repeat over the next 10 years.
1) the relative order in values were unchanged in 10 years
2) the more expensive the suburb the greater the growth rate
I can't see any reason why history won't repeat over the next 10 years.
I have (historical) Median House Price figures and gains over last 10 years...(courtesy of Victorian Valuer-General).
Altona: 1994: Median House Price: $113,500.......2004: MPH: $330,000....change of: 191%
Altona North: 1994: $104,500..........2004: $284,000.......172%
Newport: 1994: $117,000.............2004: $370,000..........216%
Yarraville: 1994: $104,000............2004: $345,005.........232%
I don't have any IP's in these areas....and I know very little about them apart from the access to Victorian Valuer-General stats.
Lol
You guys crack me up LOL
There is no way you can compare the appeal of Newport to Altona. Newport has water front areas (as does Altona), is close to Williamstown cafe scene,close to Willi beach district. Doesn't have a seaweed problem. etc. Newport train station is one of Melbournes main fully manned stations all trains stopping. Newport is 7klm to the CBD. Look at the median prices provided in the previous posts.
Also you have to differentiate between Altona proper and Nth Altona.
Yarraville is real trendy near Anderson street but has some real bad areas such as Francis st with Truck problems. You have to be careful there.
MJK
Last edited:
Two things of note about those stats
1) the relative order in values were unchanged in 10 years
2) the more expensive the suburb the greater the growth rate
I can't see any reason why history won't repeat over the next 10 years.
Twitch I've put the figures in price order for you
1994
Yarraville: 1994: $104,000
Altona North $104,500
Altona $113,500
Newport: 1994: $117,000
2004
Altona North $284,000
Altona $330,000
Yarraville: 1994: $345,005
Newport: 1994: $370,000
From this you can see Yarraville has move from cheapest, to 2nd most expensive in the list.
So I'd have to disagree with your statement that the more expensive the suburb, the higher the growth rate.... unless of course altona is due for a big correction ??
Hey, you're right.
Historic Figures..
I didn't quite finish putting up the rest of the statistics I had yesterday: (heated rush: slow hand and fast mind).
Courtesty of Victorian Valuer-General:
Top Performing Suburbs Across Melbourne 1994-2004:
Southwest:
Spotswood:..Change 1994-2004: 232%....Growth PA: 12.8%...Change 2003-2004: 9%......2004 Median House Price: $355,500
Newport:..Change 1994-2004: 216%....Growth PA: 12.2%....Change 2003-2004: 2%......2004 MHP: $370,000
Williamstown North:.. 1994-2004: 209%...Growth PA: 12%....Change 2003-2004: 8%.....2004 MHP: $417,500
Altona:..191%.....11.3%......Minus 3%.....$330,000
Williamstown:..180%....10.9%.....Minus 5%.....$530,000
I will wack this up, keep falling off my perch even logged in and remembered ...there is more...coming....soon......
I didn't quite finish putting up the rest of the statistics I had yesterday: (heated rush: slow hand and fast mind).
Courtesty of Victorian Valuer-General:
Top Performing Suburbs Across Melbourne 1994-2004:
Southwest:
Spotswood:..Change 1994-2004: 232%....Growth PA: 12.8%...Change 2003-2004: 9%......2004 Median House Price: $355,500
Newport:..Change 1994-2004: 216%....Growth PA: 12.2%....Change 2003-2004: 2%......2004 MHP: $370,000
Williamstown North:.. 1994-2004: 209%...Growth PA: 12%....Change 2003-2004: 8%.....2004 MHP: $417,500
Altona:..191%.....11.3%......Minus 3%.....$330,000
Williamstown:..180%....10.9%.....Minus 5%.....$530,000
I will wack this up, keep falling off my perch even logged in and remembered
...there is more...coming....soon......West Historic Figures..
Top Performing Suburbs Across Melbourne 1994-2004:
West:
Braybrook:..Change 1994-2004: 236%....Growth PA: 12.9%...Change 2003-2004: 8%.....2004 Median House Price: $231,500
Yarraville:...232%....12.7%.......Minus 3%......$345,005
Footscray:...226%...12.6%.......2%..............$310,000
West Footscray:..221%...12.4%...Minus 2%...$305,000
Maidstone:...217%..........12.2%.......1%.......$285,000
(Courtesy of Vic. Valuer-General Statistics 1994-2005)
some more yet...
Actually I'm done here aren't I?
There were some comments that came with these stats...Sunday Heraldsun; Sept. 18th 2005:
Bernard Salt : (social demographer)
Talking about the top performing suburbs commented: * For example, Spotswood and Yarraville all came off low bases, but they reflect the requirement in the west for versions of those funky areas that the east had..*
Top Performing Suburbs Across Melbourne 1994-2004:
West:
Braybrook:..Change 1994-2004: 236%....Growth PA: 12.9%...Change 2003-2004: 8%.....2004 Median House Price: $231,500
Yarraville:...232%....12.7%.......Minus 3%......$345,005
Footscray:...226%...12.6%.......2%..............$310,000
West Footscray:..221%...12.4%...Minus 2%...$305,000
Maidstone:...217%..........12.2%.......1%.......$285,000
(Courtesy of Vic. Valuer-General Statistics 1994-2005)
some more yet...
Interesting statistics. Braybrook being a very low socioeconomic area with lots of housing commission homes, lots of heavy industrial parts, rough and undersirable stigma attached (still present today) has outperformed trendy areas such as Yarraville, Williamstown and even Altona. I wonder if this will continue over the next 10 years. Braybrook has had close to 0% growth since 2004 where surrounding inner-west areas have shot up 20%+ in some parts.
Any thoughts?
Regards,
Ozi
TB: Seddon recorded less than 10 sales in 1994... here are stats;
Seddon: 1994 MHP (keep in mind less than 10 sold): $100,500......2004: $320,000......change? of: 218%
(Figures are from Vic Valuer-General 1994-2005)
Seddon: 1994 MHP (keep in mind less than 10 sold): $100,500......2004: $320,000......change? of: 218%
(Figures are from Vic Valuer-General 1994-2005)
Similar threads
- Replies
- 34
- Views
- 8K