Housing Shortage essay

A world wide housing shortage

A consistent story reported in the media from countries that experienced high house prices is a "housing shortage".

According to economics, price in a free market is set by the interaction between supply and demand. If supply is greater than demand, prices fall, if demand is greater than supply, prices rise. Prices have risen at drastic, unprecedented rates in many locations around the world - so self evidently demand exceeded supply. When demand exceeds supply this is called a shortage.

Demand is measured in dollars and can increase in a number of ways:

Increased number of buyers - due to immigration, births, changing demographics etc.

Increased borrowing capacity - from lower interest rates, financial innovations in the mortgage industry, or asset price gains leveraged from existing property. New lending products like subprime or low-doc loans mean that some people who may not have previously qualified for a mortgage add demand to the marketplace.

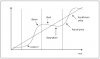
Speculative demand - buying a house because "it is a good investment" or "house prices always go up". People buying because of high prices cause a feedback effect - called a speculative bubble - which can often lead to a financial mania where prices become completely disconnected from underlying yields or value on the belief that there will always be capital gain.

Fear - Some first home buyers may feel pressured to buy now to "get on the ladder" or "before they miss the boat" causing future demand to be brought forward.

As you can see, demand is measured in dollars and is just a number in a banks computer. Thus it can change almost instantly when rates are cut or someone qualifies for a new type of loan. Supply however involves real life physical houses that have to be constructed on appropriate land.

A question to ask when seeing prices rise so dramatically is whether the "shortage" in supply and demand is due to a fundamental population to housing stock shortage or rather artificial or temporarily high demand? For if it is the latter, the shortage can disappear almost instantly with credit conditions and become a glut.

Interestingly enough, it seems that during a house price bubble, almost everyone from the media to the government to the people believe that it is due to a fundamental lack of houses. This theory is put forth by housing industry groups who ask for concessions for their industry or increased government assistance.

Media and industry commentary from around the world

USA

High housing prices, low vacancy rates, and low levels of new construction have convinced many observers that California is experiencing a critical housing shortage, especially in the state’s largest metropolitan areas.

Public Policy Institute of California (2004)

California has a housing shortage. Since the late 1980s, the number of new homes and apartments constructed has been far below what is needed to keep pace with the state's job and population growth.

Consider these facts from the California Building Industry Association:

The Department of Housing and Community Development estimates that California must build an excess of 200,000 homes each year through the year 2020 in order to accommodate the population growth and remain "reasonably affordable." The California Building Industry Association estimates the state's housing deficit total to be nearing 1 million homes and apartments in 2003.

Facts from the California Building Industry Association (2006)

Will L.A.'s Real Estate Bubble Burst? No, Because There Isn't One. There's Just Too Much Demand, Not Enough Supply and No Room to Build. None of That Will Change."

Los Angeles Times Sunday magazine cover in November 2003.

We also must work in close partnership to dispel the myth that our nation is experiencing a ‘housing bubble.’ Although the United States is the best-housed nation in the world, we as a country still face a housing shortage.
President George Bush (2003)

Australia

Chronic market imbalance will support prices.

The looming crisis in housing has left recent and aspiring entrants in to the residential market in despair. The dream of home ownership that is enshrined in Australian culture may be slipping out of reach of generations to come as affordability deteriorates to almost record levels.

.....

Underlying demand for homes will exceed 180,000 in 2007-2008 while supply will be restricted to 145,000 and by 2009 the shortfall in the housing market will approach an unprecedented 200,000 dwellings

ANZ April 2008 housing snapshot

The Housing Industry Association's (HIA) National Outlook shows a shortfall between the number of new dwellings being built this financial year and the "underlying requirement" of almost 20,000 dwellings.

Over 2004/2005 to 2009/2010, demand will have exceeded supply by 77,600 dwellings.

HIA: Housing shortage to 2010

New Zealand

Housing Minister Chris Carter after two new reports revealed that New Zealand’s most populous region faces a severe housing shortage and must accommodate growing numbers of people who may rent all their lives.

http://www.andrewking.co.nz/pm/don-t-buy-coffee-and-cars-if-you-want-a-house/

Houses and People: The facts

So how do we know if we actually have enough houses for everyone? Did every country around the world seeing record high real estate prices just not build enough houses?

How come the USA thought they had a shortage, but then when the artificial demand from the housing bubble disappeared, they suddenly had a glut? Is this likely to happen elsewhere? How can we tell?

Below is a comparison of housing and population growth for Australia and the USA using their respective census data:

USA

2001 census 2006 census

2001 US population: 285,226,284 2006 US population: 299,398,484

2001 US dwellings: 117,858,349 2006 US dwellings: 126,316,181

Population growth 01-06 : 4.97% Dwelling growth 01-06 : 7.18%

We can therefore calculate the percentage overbuilding as (Dwelling Stock Growth - Population Growth)/Population Growth. This gives an overbuilding figure of 44%

Australia

2001 census 2006 census

2001 AU population: 18,769,249 2006 AU population: 19,855,288

2001 AU dwellings: 7,790,079 2006 AU dwellings: 8,426,559

Population: 5.78% Houses: 8.17%

We can therefore calculate the percentage overbuilding as (Dwelling Stock Growth - Population Growth)/Population Growth. This gives an overbuilding figure of 41%

Australia has never had so many houses or bedrooms per person in our history. Nor has there ever been as many empty bedrooms or vacant houses (830,000 or almost 10% of the housing stock according to ABS 2006). We have constantly built houses faster than population growth.

Another question to ask is, if there really was a shortage of houses, why have building approvals suddenly dropped?

Why have new home sales dropped? Why are property developers sitting on so much unsold inventory? Why isn't the market responding with supply for this demand?

Why do these actions sound so familiar to the top of the bubble in the US market?

It is thus obvious that we don't have a supply problem, rather one of artificially high demand from easy credit and people wanting houses not just to live in, but speculative mania in a ponzi scheme.

The current state of the Australian housing market

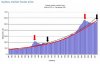
As of Q1 2008 the collapse of securitised mortgage lending markets due to the credit crunch, tighter lending standards, higher interest rates and a drop in consumer confidence have caused a drop in the amount of money borrowed for house purchases.

Remember that demand is measured in dollars, this has reduced demand. Accordingly, the number of houses for sale continues to outpace the number sold causing inventory to rise. Instead of the shortage and rising prices we are used to, the increase in inventory shows that demand is less than supply at current prices - a glut.

A glut means one thing - if sellers want to meet the market and sell their house, they will have to lower their prices.
 
Nor has there ever been as many empty bedrooms or vacant houses (830,000 or almost 10% of the housing stock according to ABS 2006). We have constantly built houses faster than population growth.

Hiredgoon,

I must say this website has been much more pleasant the last few months without you.

You keep on harping on about all the vacant houses on census night but have you considered the reasons. For instance my house was vacant, why? because being a night shift worker I was at work. What about people on holidays, girlfriends/boyfriends sleeping over their partners house, etc. and those houses that where actually empty would mostly be in a transition phase ie being sold, between tenancies, being renovated or built etc. the actual number of vacant houses would be very small.

Pablo.
 
And just on the census, do you reckon EVERYBODY fills it in. If somebody is too lazy to spend the time, couldn't they just say "so sorry, nobody was living here THAT night", and save all the time filling it in?

Just as some say their religion is "Jedi Knight" I feel sure there are other ways of rebelling against having to give such personal information.
 
Lots of comments about the validity of the census but what about the comparison with the USA? Many here say "we are totally different - we have a shortage - they have a surplus". That is worth challenging considering what happened to the USA's shortage.
 
http://www.news.com.au/business/money/story/0,25479,23619914-5013951,00.html

HOUSE prices have fallen in half of Australia's capital cities, offering the first widespread evidence that interest rates are taking their toll on values.

Also, inventory is rising drastically in all capitals - houses are coming onto the market faster than they can be sold - and this includes these new, lower prices.

Thus, it is clear the market says supply exceeds demand. Australian no longer has a shortage.

It has a glut. The market says so.

I hope there is no more mention of "housing shortages" until this supply/demand imbalance is restored (I believe at far lower prices). Speculation drove demand through the roof, and I believe that as this dries up with credit, demand will drop. Some investors will sell after seeing capital price falls while running cashflow losses - increasing supply.

Hang on!
 
Hi HiredGoon,

As you've gone to such great effort to spell out your analysis and conclusions, I thought I'd do you the courtesy of dispelling some of what I perceive as errors in that analysis in the same factual manner as you have. I too will use ABS statistics as the basis of my analysis. Not being an expert on all of the National markets however, I will limit my analysis to Sydney where I invest.

Demand:

I've taken the table from the Demand section of this Sydney report produced by the Quartile group:

http://www.quartile.com.au/Market Data/Regional Reports/Sydney Regional Report.pdf

You'll note however, that they have built it up by using ABS statistics. The key point to note is that it is predicated on both population growth AND household formation, which is something you have ommitted from your initial analysis. At an annual population growth rate of 1.1% and with diminishing household composition, it is projected that Sydney will require 2,118,043 dwellings by 2021. Given current population and household formation the total dwellings required in 2007 is 1,669,231. This means that demand for new dwellings over the next 15 years will be a total of 448,813, or 32,058 new dwellings annually.

Supply:

That report also has a table showing the Supply Equation, but to be precise I went back to the ABS stats and sourced the raw information underlying that table. The following is the new Total Dwelling Unit approvals in Sydney for the past 12 months. From the ABS site a dwelling unit is defined as follows:

ABS said:
A dwelling unit is a self-contained suite of rooms, including cooking and bathing facilities and intended for long term residential use. Regardless of whether they are self-contained or not, units within buildings offering institutional care (e.g. hospitals) or temporary accommodation (e.g. motels, hostels and holiday apartments) are not defined as dwelling units. Such units are included in the appropriate category of non-residential building approvals.

Table of Sydney dwelling unit approvals:

Total Dwelling Unit Approvals Sydney
Jan-07 1104
Feb-07 1552
Mar-07 1359
Apr-07 1284
May-07 1532
Jun-07 1432
Jul-07 1430
Aug-07 1349
Sep-07 1563
Oct-07 1142
Nov-07 2531
Dec-07 1544
Jan-08 1128
Feb-08 1385

That's a grand total of 20,335 new approvals for the past 12 months.

Demand/Supply imbalance:

Now, ignoring for a minute the current Demand/Supply situation, lets project forward. If we assume the market is currently in balance and that the Demand and Supply figures outlined above are indicative of the future market environment, then we can see a clear imbalance to under-supply of required future dwellings. This is an annual under-supply of 57% (32,058 / 20,335 - 1).

But, you could argue, that this is just addressing a cronic over-supply in the current market until we reach equilibrium again at some point in the future. I would argue that current Sydney rental vacancies at under 1% suggest that the current market is already in a supply shortfall situation. As such, the market imbalance is only set to worsen in the coming years as supply falls short of actual dwelling demand by occupants.

Conclusion:

I have left aside all discussion of investor demand, or false demand driven by speculation rather than by actual dwelling requirements for housing needs. I perceive that the actual demand/supply equation in Sydney is such that the production of new dwellings will fall well short of underlying demand for housing by new residents and diminished housing formation fundamentals. As such, I do not see that Sydney is in a cronic over-supply situation, nor that they are likely to be in the near future. This, to me, suggests that the risk of Sydney experiencing a similar housing bust to some pockets of the US is minimised.

However, I do agree that fear and greed drive all markets, and the Sydney housing market is not immune to this. I perceive that there will be some price correction, as regardless of the underlying demand/supply equation, the current cost of financing coupled with media fear campaigns will result in forced sales or fear sales which will in the short term result in supply (those wishing to sell) exceeding demand (those wishing to buy). But I believe this will be short lived as the underlying demand/supply fundamentals will reassert itself and result in a housing rebound once the current economic down cycle plays out over the coming few years.

Expect some pockets of pain and some sensationalist media headlines about 50% house price reductions, but also expect it to be short lived and part of the normal economic cycle.

Sincerest Regards,
Michael.
 
MichaelWhyte - inventory is growing and prices are falling. The market says glut.

Do you think the market is wrong?

If you look at my essay you will see that many commentators believed that the USA had a shortage - why would the Americans be so wrong, yet the Australians so right?
 
MichaelWhyte - inventory is growing and prices are falling. The market says glut.
OK, I'll give this one more go then right it off as a lost cause as it seems you're not really listening and are locked into your POV. Correct me if I'm wrong on this.

OK, price is not a determinant of the underlying demand/supply situation. Ignore price for a bit and step back. Price is determined by "willingness" to pay for a desired object and is influenced by fear and greed. I demonstrated that although "inventory is growing", it is not growing fast enough to keep up with the increasing underlying demand for accommodation.

Now, what price the market puts on the exchange is anyone's guess and fear seems to rule the day for now, but my contention is that this fear will abate pretty quickly and then greed will re-assert itself when people realise there genuinely is a shortage of accommodation relative to those households requiring it.

The market isn't saying glut, the market is saying fear. Big difference. The underlying demand/supply equation is actually saying under-supply.

Cheers,
Michael.
 
Hi Feihong - I use the US census data over the same period to compare vs the Australian census.

http://www.census.gov/popest/states/NST-ann-est.html 2001
http://www.census.gov/popest/housing/HU-EST2006.html 2006

The US census said over supply while the US media said shortage.

Eventually the media was proven to be mistaken.

The Australian census said over supply while the media said shortage.

price is not a determinant of the underlying demand/supply situation

Really? A lot of text books need to be updated....

Fear is a part of demand. Just like greed was when people were buying houses for far more than their rental yield because they were speculating on capital gains.

When this speculative/easy credit demand disappeared in the USA the shortage turned into a massive glut. Then the underlying population/household numbers became important.

I believe that as speculative/easy credit demand disappears in Australia the shortage will turn into a massive glut.

It has already begun.
 
HG and others,

One final post here, and at least then all the real facts are on the table for others reading this thread. Its clear that HG has a different take on the facts and a different interpretation of Demand/Supply, but that's his privelege.

OK, I've already demonstrated factually that underlying demand/supply is in shortfall (under-supply) and that this is set to worsen in the coming years, but now lets look at the impact of emotion on equilibrium price.

The first attachment below shows three different demand/supply charts which I will describe briefly.

Chart 1: Market underlying demand/supply

If we assume we are in market equilibrium (which I actually contend we are in shortfall) then the equilibrium median price of $530K is representative of true market value.

Chart 2: Fear drives demand down

But what is happening at present is that a lot of media reports and the HGs of the world are out there beating up sensationalist articles arguing cronic over-supply and the end of the property market ponzi scheme. They are way off the mark, but nonetheless some people believe them. This results in reduced buyer demand pushing the demand curve to the left and the exchange price down on transactions. The underlying demand/supply equation hasn't changed but prices have dropped. This has a snowball effect as media sensationalises these drops.

Chart 3: Fear drives more supply as does higher interest rates

Now you also have the compounding effect of spooked owners wanting to beat the "crash" and putting their property on the market. This pushes the supply curve to the right and reduces the exchange price further. Again this has a snowball effect. Couple this with cyclicly high interest rates and there is some additional forced sales pushing the supply curve further to the right and the exchange price further south.

Summary:

None of this has an ounce of impact on the underlying demand/supply equation for accommodation. It is all a factor of fear driving the exchange price down which becomes self-fulfilling for a while. I expect to read a lot more of this sensationalist stuff for the next few years. However, at some point the market wakes up to the true underlying demand/supply reality and equilibrium price reasserts itself. i.e. In my Sydney example prices jump back from emotionally driven $480K levels to $530K levels.

This is all typical market cycle stuff which is illustrated graphically in the second attachment. Market imperfections (fear/greed) distort market equilibrium pricing so we never run in the perfect straight line of price appreciation that we would achieve with perfect market transparency.

The final attachment shows the median house price chart for Sydney as at today. I contend that we are pretty much on the equilibrium price point now similar to where we were in about 1993. I also project that the median price has more risk to the downside than upside in the short term, but medium to long term should see a return to normal levels of appreciation followed by the next boom when greed takes over and we over-run price equilibrium to the upside again.

There ya go, property economics 1.0.1 for the uninitiated. Hope you enjoyed this little monologue.

Cheers,
Michael.
 

Attachments

  • Demand Supply impact on equilibrium price.JPG
    Demand Supply impact on equilibrium price.JPG
    34.7 KB · Views: 128
  • Boom Bust price cycle.JPG
    Boom Bust price cycle.JPG
    17.2 KB · Views: 120
  • Sydney Median House Price Graph.JPG
    Sydney Median House Price Graph.JPG
    31.9 KB · Views: 116
HG, Michael:

Great debates with facts and figures! I was thinking something like what Michael just presented, and more importantly, arguments from both sides do not contradict each other, and it does leave for open interpretation.

In the US, with such a significant variance in ethnic, population and geographic distribution, combined with different laws in different states, the "volatility" is obviously is going to be far greater than here, and overshoots in prices up and down are also going to be larger. Add this to media sensationalisation, and we get even more volatility. Median figure can therefore look much better or worse than it actually is. Parallel can be drawn when you look at sharemarket chart.. over long term it always goes up, but when you magnify it 100 times the volatility will scare the c**p out of you!
 
The final attachment shows the median house price chart for Sydney as at today. I contend that we are pretty much on the equilibrium price point now similar to where we were in about 1993. I also project that the median price has more risk to the downside than upside in the short term, but medium to long term should see a return to normal levels of appreciation followed by the next boom when greed takes over and we over-run price equilibrium to the upside again.

Appreciate the effort to discuss the issue. The chart on median house prices is fairly useless unless you look at it relative to the prices of something else - typically this would be wages (price of labour) or rents. On that basis I think we are far from equilibrium.

As for demand / supply I agree household formation numbers are important on the demand side. If you forecast diminishing household composition with population growth you will need even more houses - true. But I think this variable is fickle and that is why the USA turned on a dime. People in the USA were looking at diminishing household composition and immigration and forecasting an enormous shortage. Then once prices turned there was suddenly a glut and I think it's because people were happy to live with parents, flatmates etc while prices are on the way down. The bottom line of all this is underlying demand is not rigid - it is very flexible depending on people's mood / choices.
 
Hi all,

HG,
Supply and demand are not equal in all areas. There can be gluts in some areas and shortages in others.

Not many here believe everything that we read in the media. For example, 'median housing is unaffordable'. That does not mean housing is unaffordable, in fact in another thread a month or 2 ago, it was easy to show that housing WAS affordable.

In my local town, there is currently a glut of houses on the market, with prices being a little soft. This is partly due to all the building that has been going on over the last couple of years. I take it this is your point Australia wide. However the population is growing, and this short term glut will eventually disappear.

I'm sure that the people who want to live in the inner suburbs of Melbourne will not just up and leave because there is housing available in Colac.

Pure economic theory would suggest that people will move from the shortage to the glut, through the price mechanism. Unfortunately that is theory not reality. In the real world the supply /demand equasion is very localised when it comes to housing, and your macro theory is just that, a theory.

bye
 
The bottom line of all this is underlying demand is not rigid - it is very flexible depending on people's mood / choices.
Hi YM,

Yep, agree with this too. So whilst fear rules the day, demand dries up. That's the second chart in my demand/supply series. But eventually that underlying demand based on "desired" household formation reasserts itself. And once any price correction plays out, greed will come to the fore again when the market starts to show some positive returns. The cycle starts over and we over-shoot to the upside on price as speculators chase leveraged growth returns.

Its all a cycle, I guess the difference of opinion lies in where we are at in the cycle and the true nature of underlying demand relative to supply. I put us pretty much at equilibrium in underlying demand/supply and 6 or 7 o'clock in the cycle. I accept though that this equilibrium is determined by desired household formation and accommodation standards, but is subject to being subjugated to fear in the short term.

As I've also said, I think the risk is to the downside in the short term, but I also think this will be mitigated in Sydney by the stagnant growth over the last four years and the improving yield equation.

I wouldn't be surprised to read reports of 50% drops in some suburbs, but I don't think these drops will be sustainable. If it were a share market and I was a commentator my advice would be: "buy the dips" because I believe the market fundamentals are still strong.

Cheers,
Michael.
 
Ok, a few key points people seem to have missed:

-Demand is expressed as a price.

Demand also includes borrowing capacity and speculative demand

As I hope I have shown, house prices in Australia BOOMED even though we built houses far faster than population growth.

Thus borrowing capacity and speculative demand outweighed the overbuilding vs population/housing fundamentals during boom times. However - these are disappearing as credit tightens and people no longer believing "house prices always go up"

House prices rose because we got lots of easy credit.
Then people started buying houses because they were going up, not caring about rental yields or risks.
Then houses were revalued upwards and people could borrow against existing equity to buy more houses.
Thus house prices went up.

Demand drastically increased and supply couldn't possibly keep up because it involves physically building houses. Thus prices exploded.

The same thing happened in real estate markets ALL AROUND THE WORLD. Except Australia was one of the most spectacular.

A classic Ponzi scheme. Which always fails eventually.
 
MichaelWhyte - inventory is growing and prices are falling. The market says glut.

Do you think the market is wrong?

If you look at my essay you will see that many commentators believed that the USA had a shortage - why would the Americans be so wrong, yet the Australians so right?

Your commentators leave a lot to be desired. One social policy group (who ALWAYS want more houses built), a building association (who ALWAYS want to promote more houses to be built), a magazine cover (dont even get me started on the credibility of THAT one) and quite possibly the stupidest US president ever.

And most of them were just as the building boom started from the introduction of subprime mortgages (around 2004ish). Oh, and ALL from one state, California. Nothing from anywhere else.

And, BTW, why are people who buy houses sometimes called investors, but when its a negative article, they're called 'speculators'.

If I were marking your essay, I'd be marking it down because your argument is supported by opinions. Having said that, gramatically, it reads quite well.
 
Back
Top