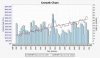
On this point Propertunity is correct.....(Not much of a sample size,
Well it was one whole suburb. I can do an LGA, but the chart looks pretty much the same.
and no indication of the underlying assets - eg, old buildings being replaces with new apartment blocks in the suburb may increase the median as well).
No data collectors separate out the sales in new Vs old buildings. However, I have only been buying, renovated in old buildings or old in need of a reno, and I have witnessed first hand the growth in these types of units.
It does not necessarily mean all growth.
That's quite true.....and we all know the issues with just looking at medians as only one indicator.
We also have the "Renevation Rescue" days. Money pumped into renovations. This may increase the prices overall, but again, not necessarily all growth.
That's also true. But just as true is the scenario that craigb noted, where damaged property, distressed sales, lower priced property selling in a Qtr due to FHB activity, etc can make the median seem to "fall", when in fact the market is not falling at all.
The fact is, that a previous trend does not always mean that the same will occur in the future.
That's also true......but if something has done something for a very long time, you have to ask yourself, on the balance of probabilities, what are the chances of something completely different occurring?
And even if you accept the fact that something completely different will occur (and I don't), but accepting that, what impact will it have on my long term goals? (Personally, I can tolerate an occassional dip on a chart or a long flat period - that is just the nature of the underlying asset.)
While bluestorm, you were busy de-leveraging to 28% LVR, others were leveraging up to 95% LVR, and in the case of this particular suburb, picked up 20-25% CG in the space of about 18 months. So for example, people who bought at $420K are now sitting on a val of $520K and $100K of equity.
To each his own.

 . Obviously your listening to the RBA and Fed too much. It's not doing anything of the sort anytime soon. Another dip on the way.