what's the average annual Brisbane house price growth over next 2 years going to be??

what's the average annual Brisbane house price growth over next 2 years going to be??


  • Total voters
    61
  • Poll closed .
Hmmm......you watching Steve Keen too much.....I can't see drops of that magnitude outside of properties over the $1m mark.

10% drops in the middle to low end is possible depending on how bad the economy gets.....but 5% is more likely.

Cheers
Sash

Since property markets tend to lag behind sharemarkets by about 18 months, I would expect drops between 30% and 40% (for those 2 years).
 
The Brisbane market has beat the odds on more than 1 occasion
and considering that interest rates are now falling I don't expect a significant correction if any.

I am suspecting that perhaps the top end could come down while the bottom end (assisted by the FHOG) comes up a bit.

IMHO
 
Since property markets tend to lag behind sharemarkets by about 18 months, I would expect drops between 30% and 40% (for those 2 years).

ASX dropped by 50% in 1987, when was the property crash after that?

Is your figure of 30-40% in real terms or including inflation over the 2 years it drops?
 
10% drops in the middle to low end is possible depending on how bad the economy gets.....but 5% is more likely.

Well Brisbane is down 3.3% for the September quarter.
http://www.abs.gov.au/AUSSTATS/[email protected]/Lookup/6416.0Main+Features1Sep 2008?OpenDocument

What the hell does "less than -2% (ie increase per year %, but averaged over the next 2 years)" mean? Can somebody interpret for me? I checked this box, but only because -10%+ per year was not available as an option...
 
Given the uncertain world we live in,"Changing Prices"only adds one more element of uncertainty,just keep in mind Max that Brisbane is a very large area,and it is naive to conclude that everyone is harmed by what happened in the Sept-quarter,one area we invest in went up over 30% this year alone,and that's only with my basic method of analysis, but i know one item up front the amount of for sale signs that are going up in several area's i watch would be a worry to anyone wanting a quick sale
no matter what the price is,the lull before the storm..
imho..willair..
 
just keep in mind Max that Brisbane is a very large area,and it is naive to conclude that everyone is harmed by what happened in the Sept-quarter,one area we invest in ...
You'll be pleased to know then that I concluded no such thing! :p

Besides, lower home prices are a good thing. Both for investors and those who care about the balance between how much we spend consuming (homes are technically a "consumer durable") and how much we spend saving/producing. :)
 
good point willair

it would be interesting for example to see the stat's (i.e. growth so far this financial year) for the inner ring part of Brisbane, say up to 12km out.
 
You'll be pleased to know then that I concluded no such thing! :p
Good to see you understand another level of complexity in making your finanical decisions,btw i have been reading some of your posts Max on that other site:rolleyes:,and until the calculations are made noone can be sure if inflation is helpfull or harmfull to a specific entity,no matter if it is a unit in a complex of 12 other units in Logan,or some run down fibro inner city riverside property on above 1000 sqm..imho willair..
 
i know i am not saying anything new, but the options given on the poll reveal a lot about the poll-makers way of thinking. brissie is down 3.5% in the sept. quarter alone and i find it difficult to imagine that, given the bloodbath of october, that property will be improving anywhere in aus in the near term. and so the "worst" possible selection of -2% over 2 years... well, its already obsolete.

turn that 2 into a 20 and you would have my vote.

we are seeing more than just a leveling off of prices, we are seeing a shift in momentum. and the trend is picking up steam.

of course i am looking it from the very narrow perspective of a FHB looking for a PPOR only. so my priorities differ a lot from others, but i think failure to consider that we might see anything more than a 2% decline over the next 2 years... well it seems to me to be a dangerous, dangerous oversight. especially since that target has been almost doubled in a mere 3 months...
 
and so the "worst" possible selection of -2% over 2 years... well, its already obsolete.

turn that 2 into a 20 and you would have my vote.

Last time I checked two years is a long time from one quarter. Also if I was marking you I'd have to give an F as the question was for the next two years and posted on 31.10.08.

So the last quarter wouldn't be a valid component of the answer.

Like my son who is sitting his Year 12 exams, you need to read the question and see what is there...not what you want to see.

Cheers

Shane
 
you need to read the question and see what is there...not what you want to see.
What is there is 8 options for prices rising, from slowly to 300% the rate of inflation. And only 2 options for prices falling a little bit.

Not a single option that goes anywhere near the current rate of decline, nor one that is within cooee of what my models are predicting (they're all far too high). Urchin's point was very good. The design of a poll should include a range of options reflecting the range of possible answers. This poll has failed to do so, as illustrated by the most popular option. The poll has been designed in such a way that we can conclude only that 40% of respondents expect prices to fall, and that the largest group of respondents expected falls to exceed 2%.

That's the really interesting bit, but would it not have been nice to know a bit more about this remarkable response?

Urchins point was in error as he believed one quarters data was able to be extrapolated over two years and make the decine response to the question "obsolete" as he described. I know you know better than this Max because I have seen the quality of some of your posts past and present :D

Urchin did qualify his answer with his FHB perspective.

The YOY average is still up not down. That may change but it does not change the fact that Urchin's answer was pertaining to the past quarter not the long term average or the question. I agree with you that the poll should have had a better balance in the range of probabilities.

Cheers

Shane
 
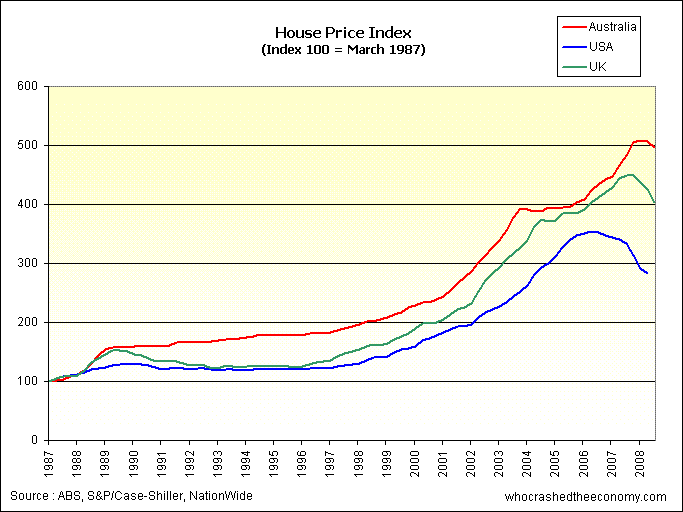
Here's a fascinating chart from whocrashedtheeconomy.com:
housepricesaust_us_uk_sep08.gif
 
Last time I checked two years is a long time from one quarter. Also if I was marking you I'd have to give an F as the question was for the next two years and posted on 31.10.08.

So the last quarter wouldn't be a valid component of the answer.

Like my son who is sitting his Year 12 exams, you need to read the question and see what is there...not what you want to see.

Cheers

Shane


thanks for the snide reply shane. I am tempted to reply to you in exactly the same manner.

I am aware of the difference between a quarter and 2 years. perhaps you could read my whole post too, and particularly the part where i say that this is indicative of a change of momentum. If you want to argue that point, fine, but i think enough has happened in recent months to make it necessary to at least acknowledge that house prices might not go up for ever and ever and ever. i think we might want to at least acknowledge that a significant drop could happen--may well be in the process of happening.

my point--which you so blithely ignored (thanks for that)--was that the bias of the poll (where the choices basically ranged from "a little growth" to "unbelievable growth") represented a dangerous limitation in the poll-makers outlook. you do not need to agree with me that a drop is imminent, but it seems foolish in the extreme to ignore the very possibility of it.

my point is basically the same as yours--you need to be able to see what is there and not just what you want to see...

does that help? or should i try to be more patronizing?
 
Hi Urchin

I am sorry if you took great offence at my post. I was trying to highlight the importance of looking at the underlying trend and avoiding confirmation bias of short term data and noise. I did read all of your post and if you saw my reply to Max, I actually agreed that the poll could have been better segregated.

Whilst the first down day of data in any series may indicate the beginning of a downward trend, most traders know that it is only possible to trade or invest now.... so the short term noise of a single data point can hide the underlying trend if that is what you are watching.

The possible effects of the current crisis (as originally highlighted by he who will now be known as Sunfish) was discussed at length a couple of years ago or further. Most here adapted their portfolios to the possible issues. A few didn't but they will be wiser after the event and much better investors for it. I suppose I was tired of hearing strident warnings of impending doom, when as a an older investor, I am now looking further forward to the opportunities ahead.

I hope that you find that first home that you are looking for and wish you well.

Cheers

Shane
 
Back
Top